Clemson, South Carolina · The state of our water
We keep sealing a little more of our ground under roofs and pavement, and the rain that used to soak in runs off instead. Here is what four decades of that has done to our water — measured in our own numbers — and the chance we have, right now, to turn it around.
The finding
Healthy soil soaks up rain and lets it out slowly — feeding plants, refilling groundwater, and keeping a creek running between storms. Every roof and road we add takes a little of that sponge away. The federal government has watched it happen from orbit, one year at a time, since 1985.
Sealed (impervious) surface, 1985–2023. USGS Annual NLCD, 30 m, boundaries held fixed. Thresholds from the Center for Watershed Protection's Impervious Cover Model: streams begin to degrade past 10%, and generally stop supporting healthy life past 25%.
Why it matters
All the water we don't let soak in still has to go somewhere, so it rushes off the pavement and reaches the creek all at once. Scientists call that flashy — a hard pulse during the storm, then very little in between.
A creek fed by groundwater runs steady all year. A creek fed only by runoff runs hard for a day and then drops to a trickle — and a channel that never gets a steady base flow struggles to hold its banks or its life. That's the quiet cost of sealing the ground: not a flood we can point to, but a slow drying-out.
The encouraging part is that this is fixable right where it begins — by putting the water back into the ground before it ever reaches the creek.
Watch it happen
None of this arrived as a flood. It was a choice made one lot and one rooftop at a time. Drag through the years and watch the land change: since 1985 the city has traded 721 acres of forest for 819 acres of developed land, on the very same ground. Tap any wedge to follow its story.
Land cover for the City of Clemson, 1985–2023. USGS Annual NLCD, 30 m. "Developed land" is the built-up class — houses, roads, and the lawns and parks between them — so it's much larger than the paved-only figure above (about 19% today). It isn't all pavement, but it grows for the same reason. The comparison places (campus, the Upstate, South Carolina) use the same NLCD product sampled coarser across the larger areas — screening-level, so read the shares, not exact acres.
You can feel it
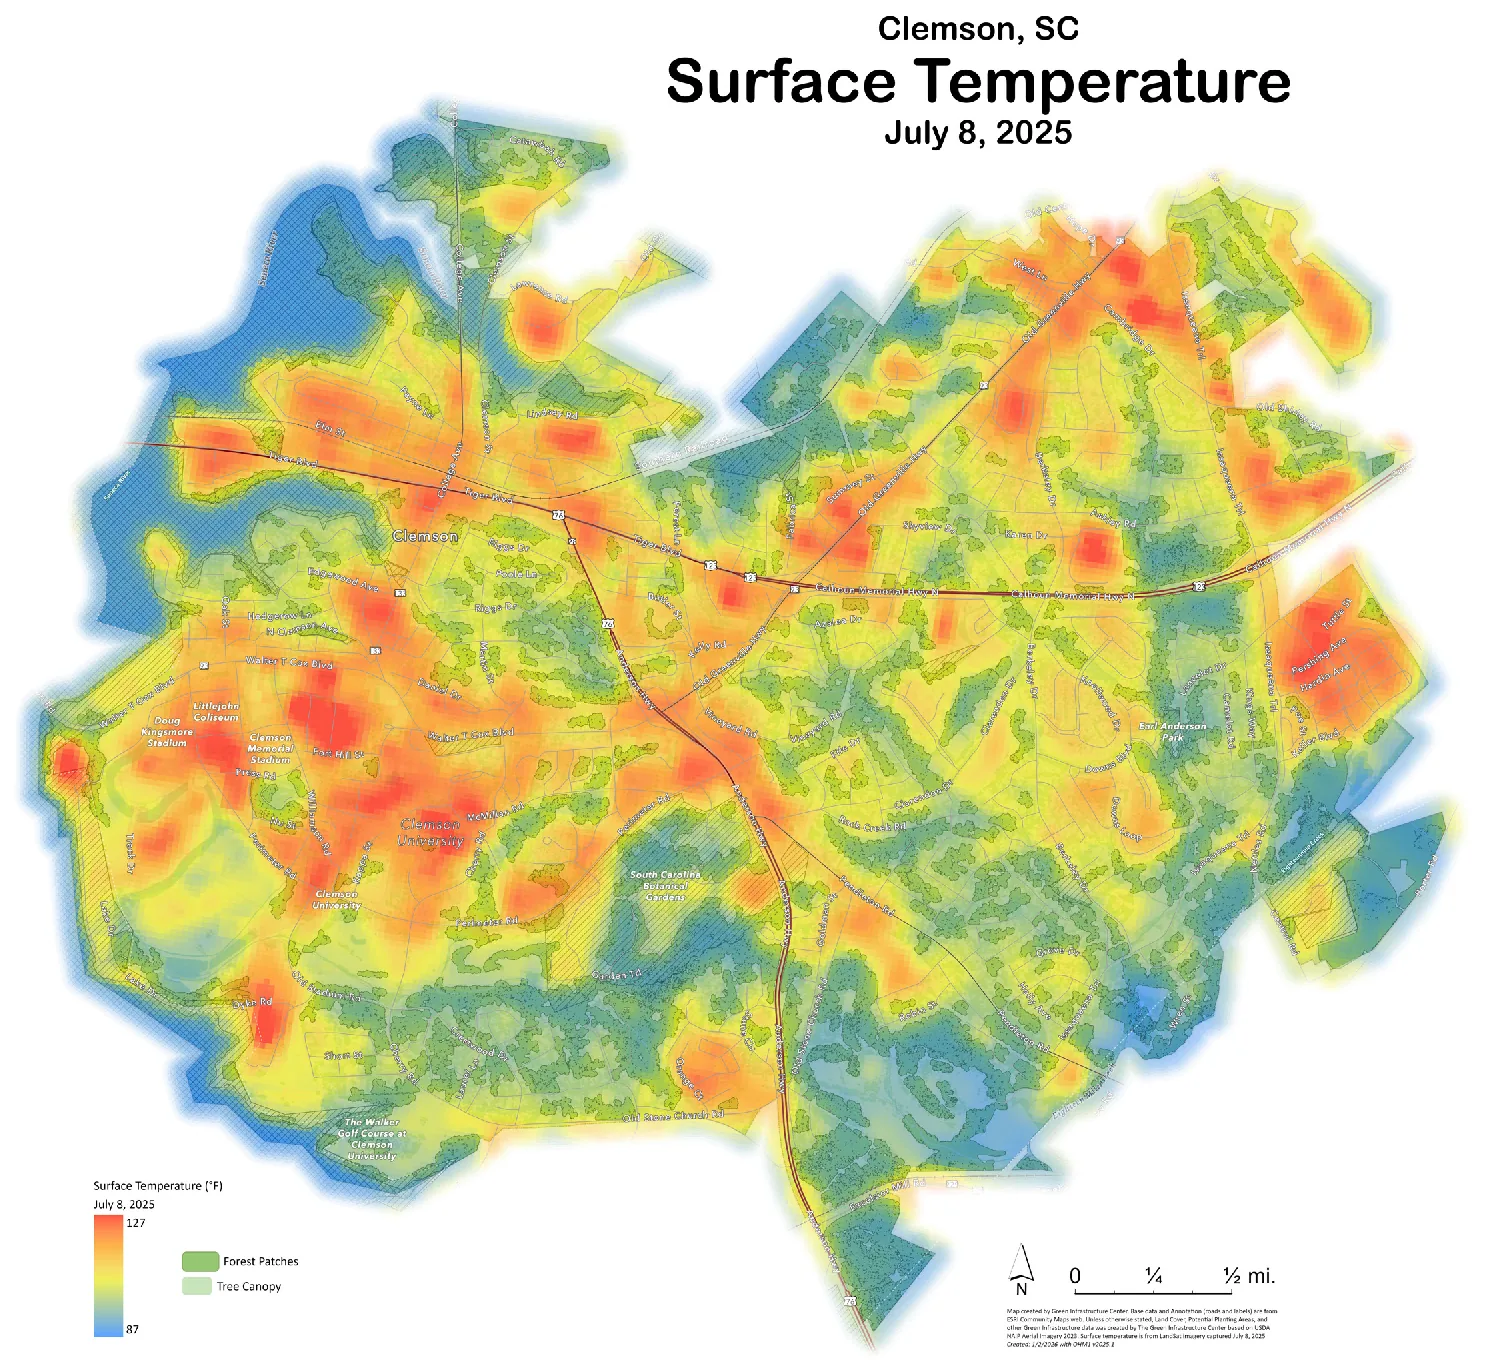
A living, watered landscape spends the sun's energy lifting water into the air, and that keeps it cool. Take the water out and there's nothing left to do that work, so the heat just sits. On this July map, the bright places aren't the forests — they're the parking lots, rooftops, and roads.
Green Infrastructure Center / SC Forestry Commission · Clemson Green Infrastructure Assessment, April 2026 · Landsat, 8 Jul 2025; range from the map legend.
It's a fight we're still early enough to win. The same assessment maps 58 acres of highest-priority planting — about 4,980 trees — in the hottest, lowest-income neighborhoods, where a little shade does the most good.
The fix already has a shape
"Sustainability starts with stormwater."
— Rick Huffman, Earth Design
The answer isn't a bigger pipe. You can't out-engineer flashy water; a beautifully rebuilt creek still gets scoured by every storm if the land above it keeps shedding water. The real fix happens before the water reaches the channel — slow it, spread it, sink it into the ground. And the same idea is already written into plans at four scales, from a single Clemson block out to the whole Blue Ridge.
The Sustainability Committee's draft guidelines ask new development to release less water than the bare land did — 75% of the peak, not 100% — to keep the first inch of every storm on site, and to put roof-water back to work. The oldest tool, the bare detention pond, is ranked dead last. Draft — not yet adopted
Clemson brought in the Green Infrastructure Center to find what's worth saving and design the incentives. Their top recommendation matched the committee's exactly: reward low-impact design with a point system, and trade permeable pavement, green roofs, and kept forest for permission to build.
More than half of South Carolina is still intact habitat, but only about a quarter of that is protected. The templates exist — some counties already require half of every new subdivision to stay connected open space, and a 100-foot forested buffer strips more than 90% of the nitrogen and phosphorus out of runoff before it reaches a stream.
Up here the worry is drought, not the coast's flooding, because our water starts in mountain springs and heads downhill from here. That's our advantage: keep the rain at elevation and sink it in, and we steady our own creeks through the dry months and send cleaner, calmer water to everyone downstream. The regional plan names Clemson by name, and three neighbor counties already run their own conservation funds. Our answer is simple — keep the water home, and let it soak in.
Here's the opening: Clemson is rewriting its entire development rulebook right now — a new Unified Development Ordinance. It's the once-in-a-generation moment to ask new building to keep its own water home. Not to punish growth, but to make sure the Clemson we hand down still has creeks that run.
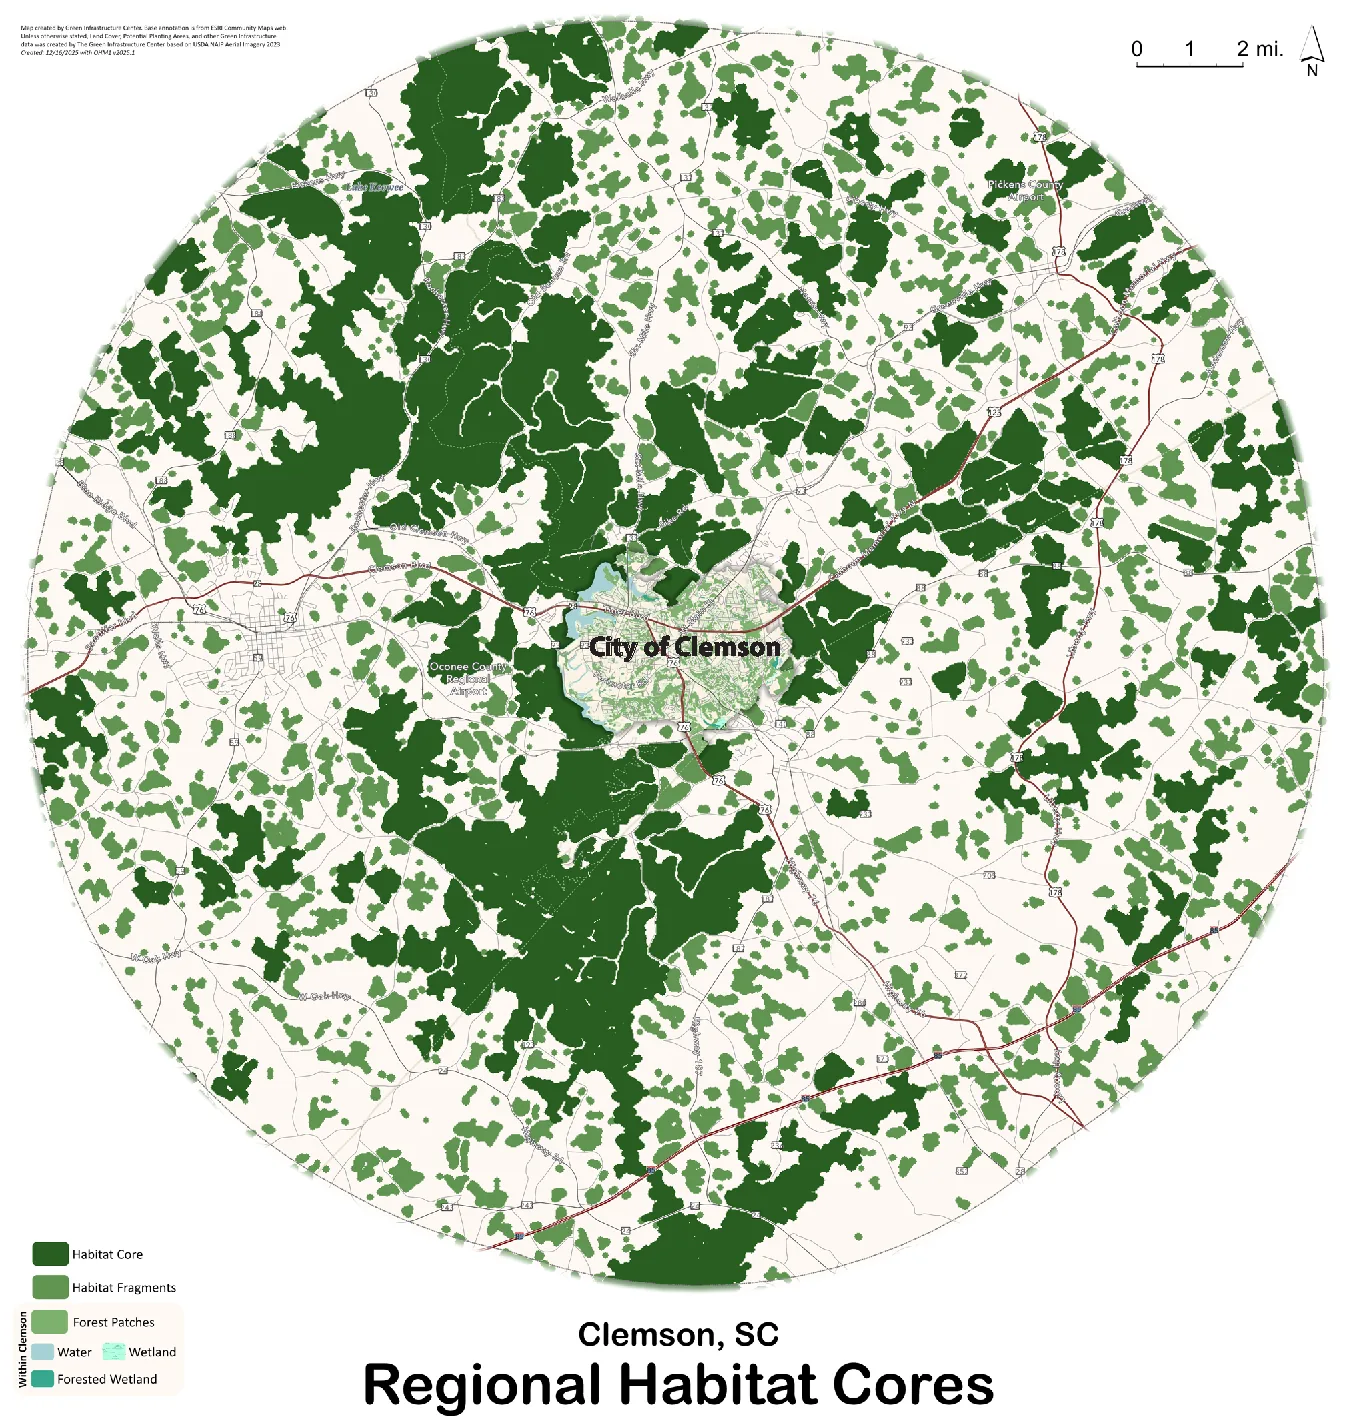
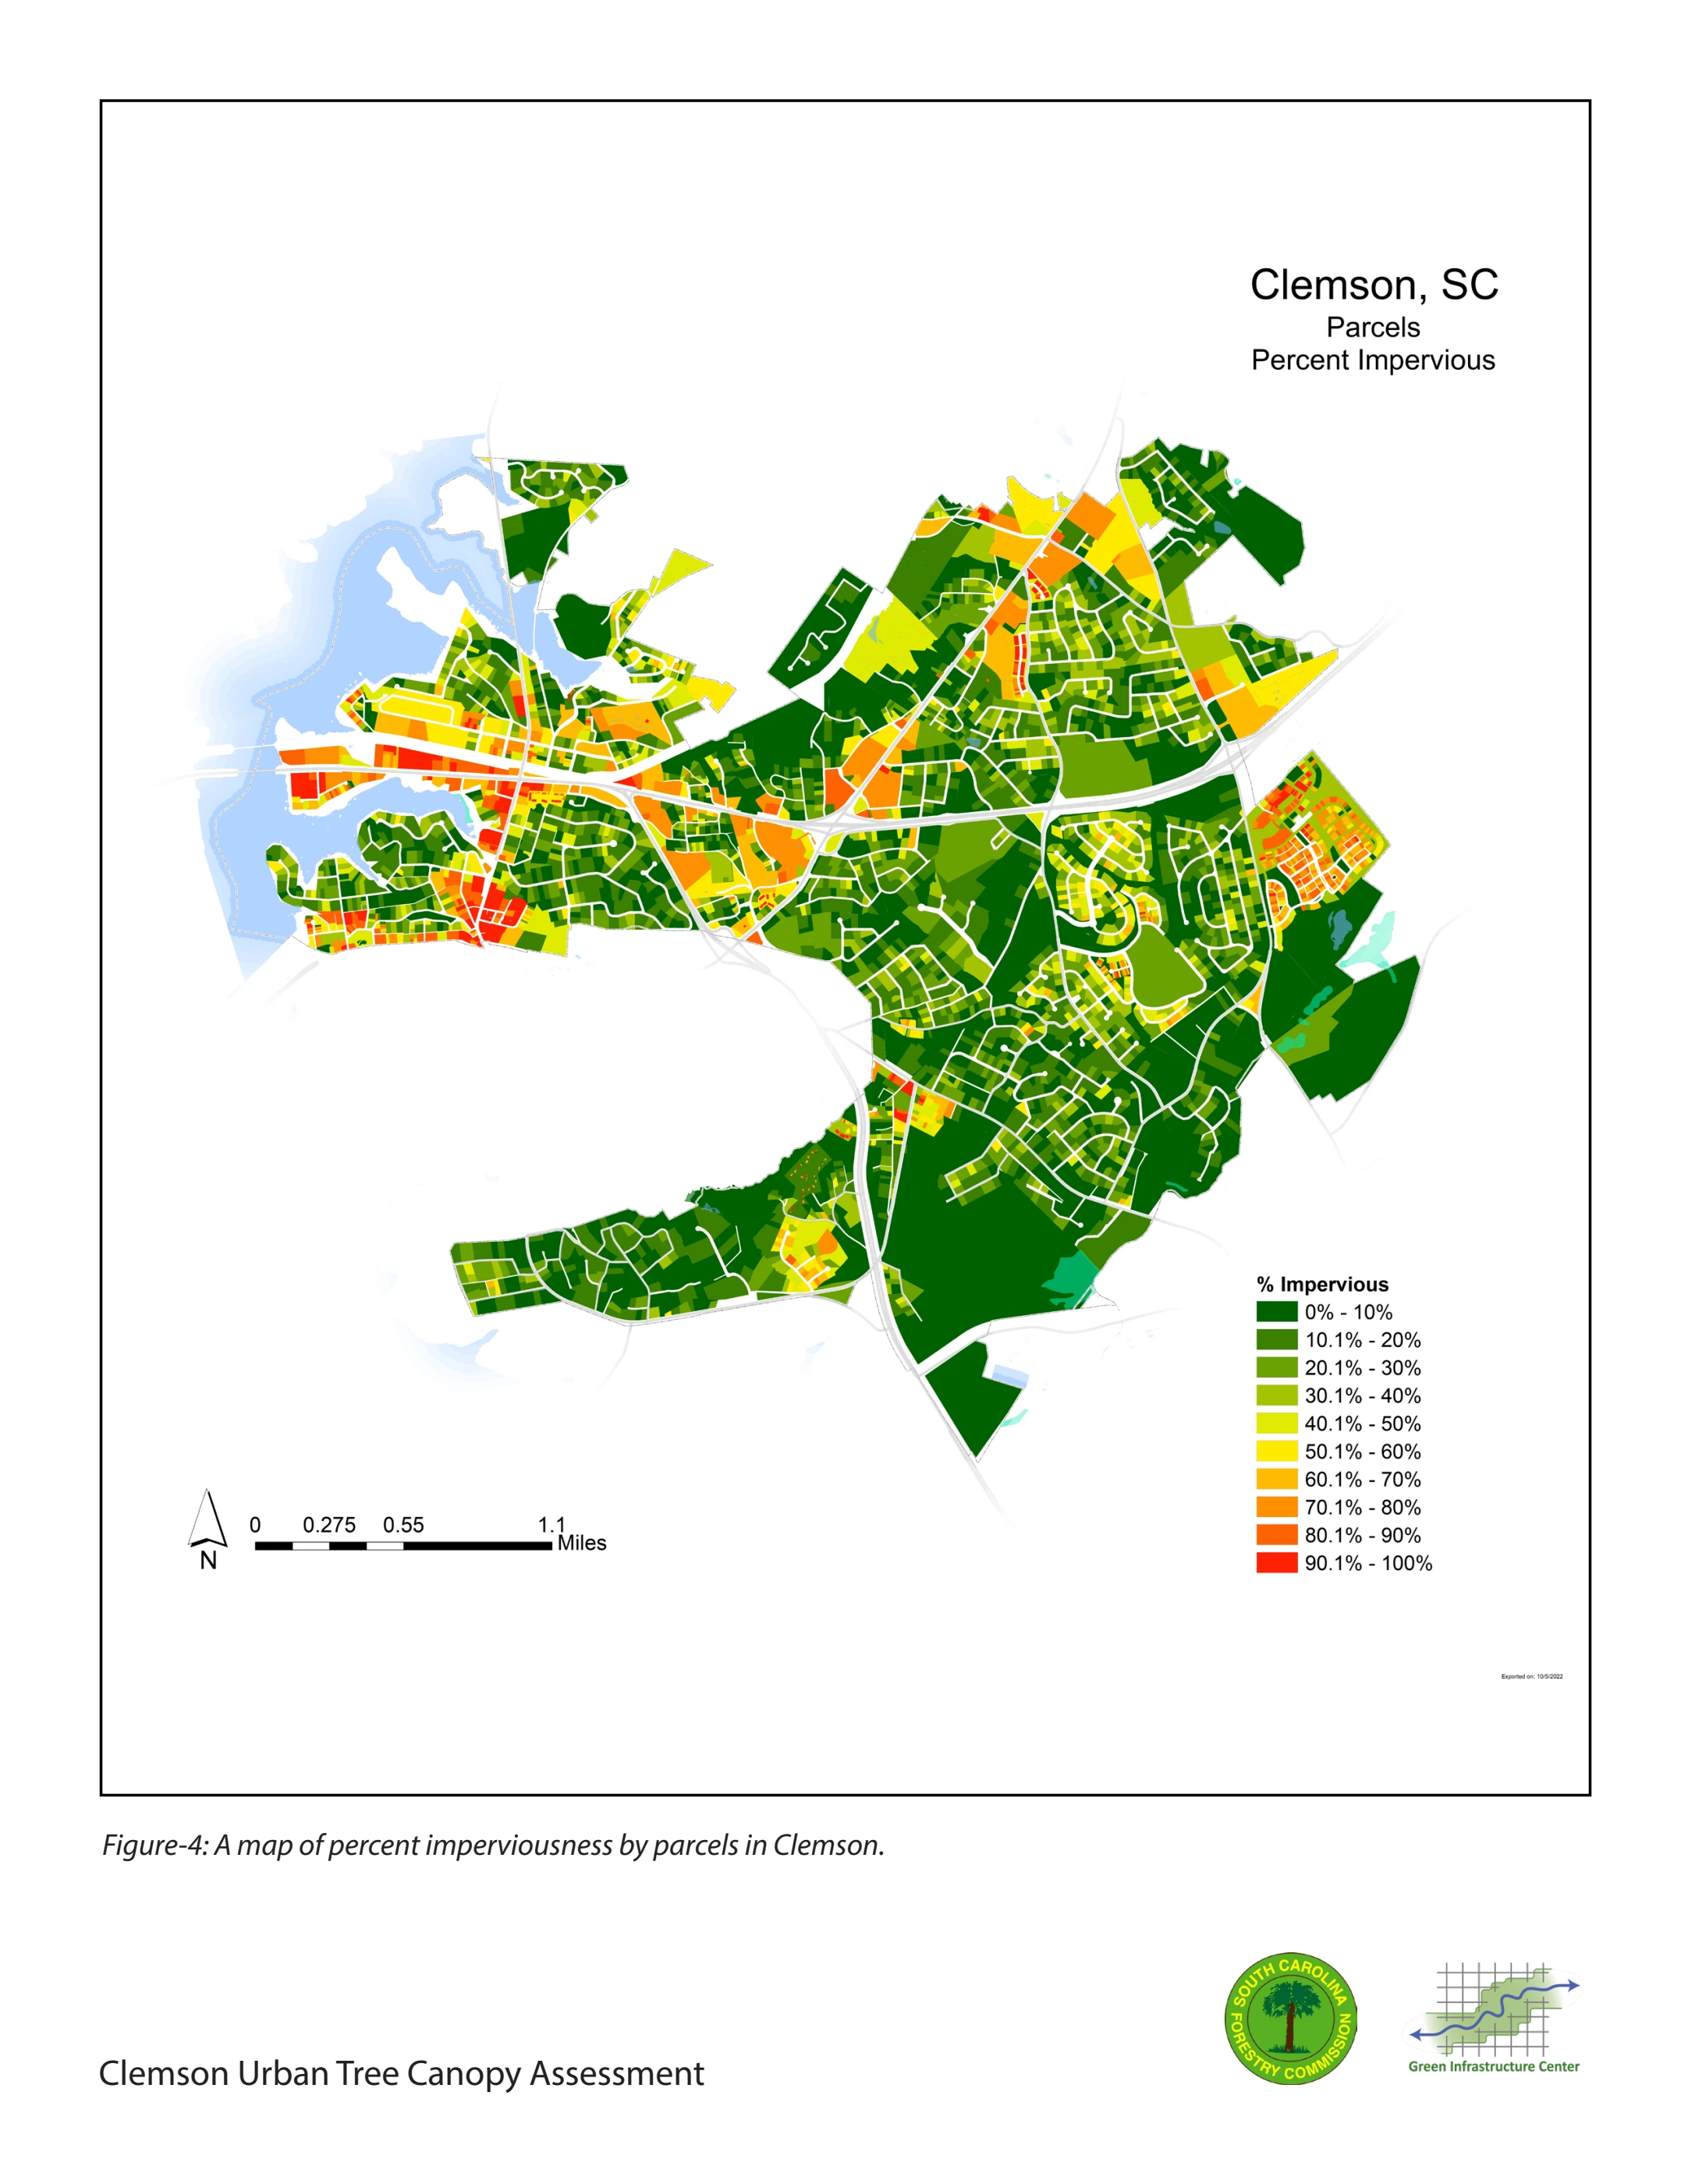
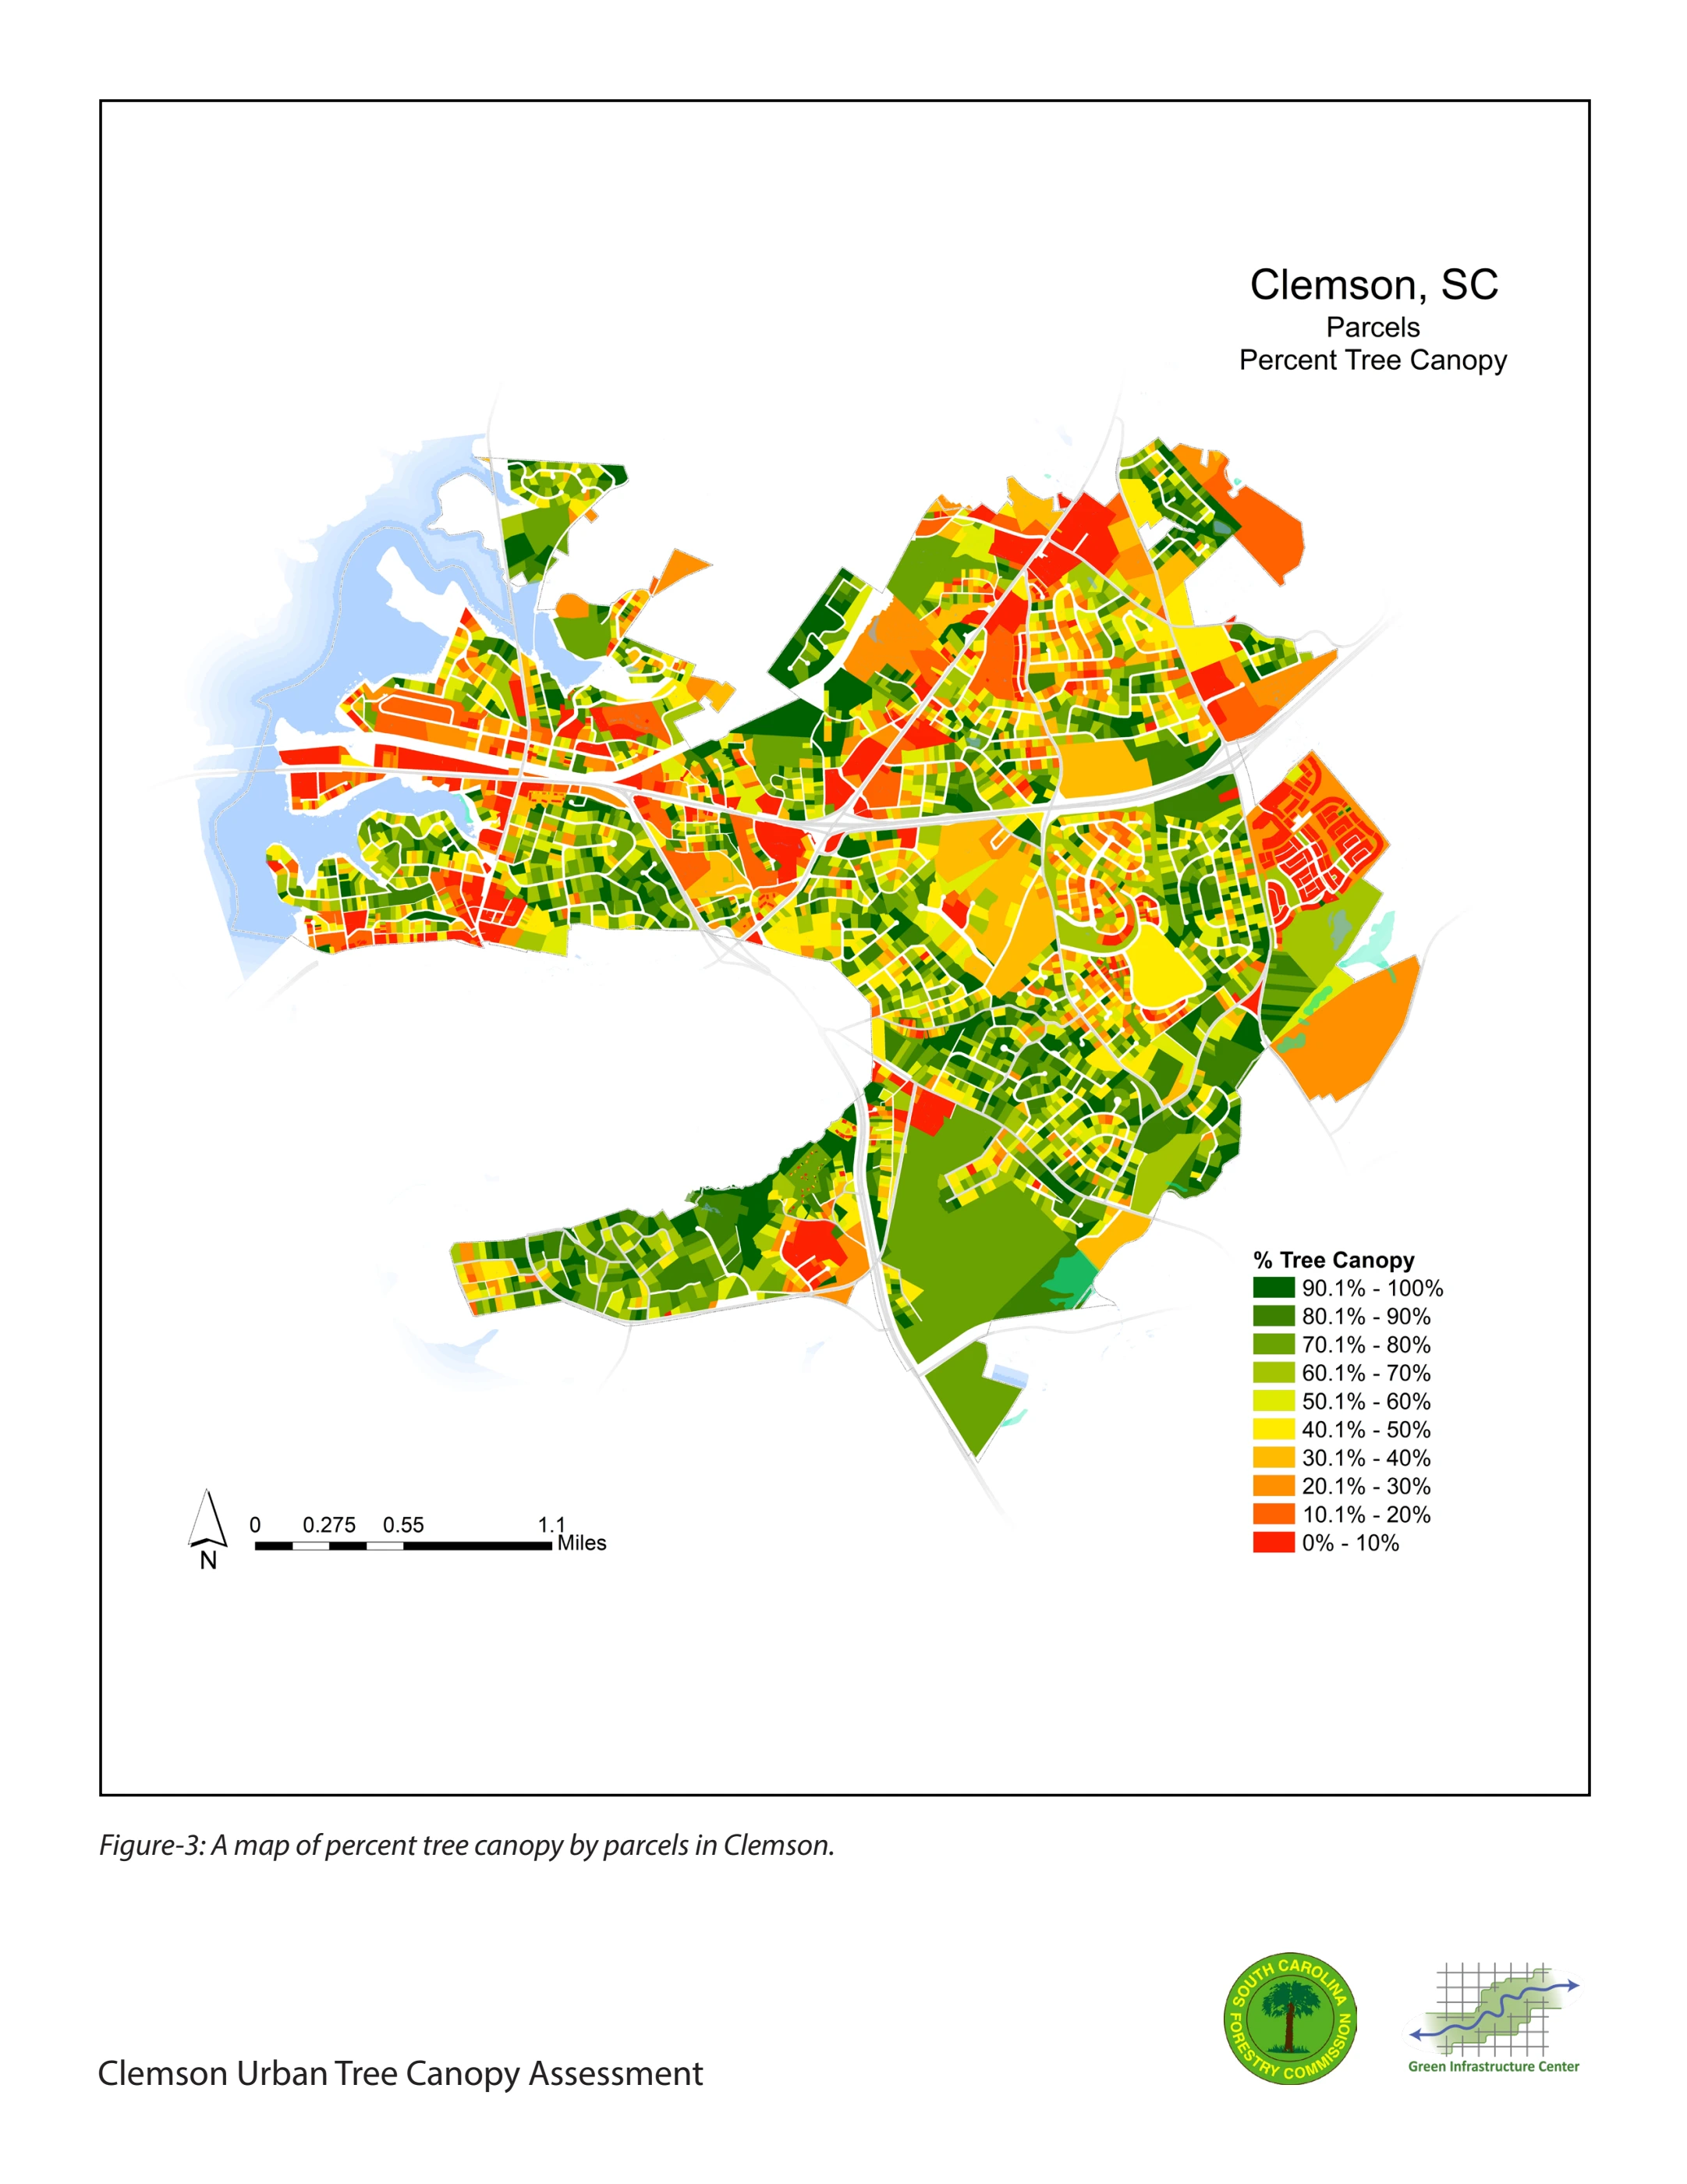
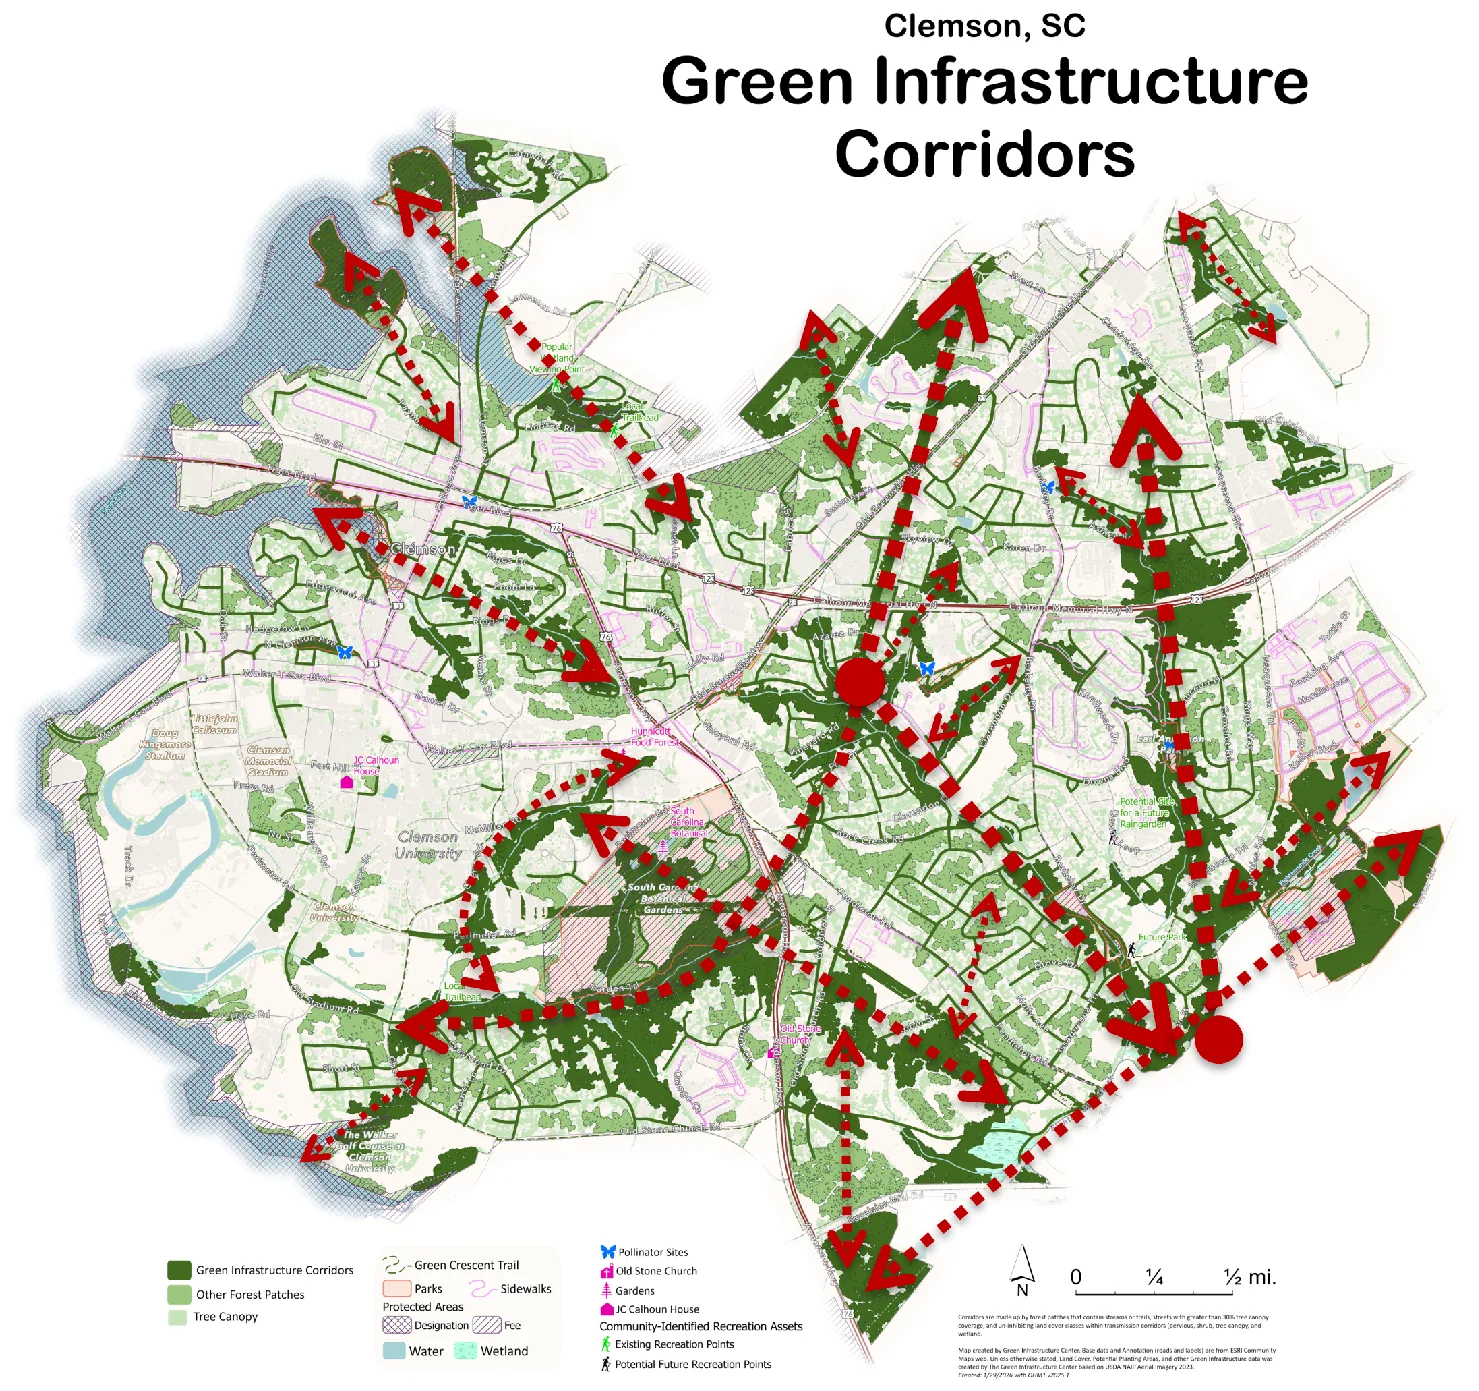
Maps: Green Infrastructure Center, for the City of Clemson under an SC Forestry Commission grant. Reports: Urban Tree Canopy Assessment · Ecosystem Services Analysis.
What the fix looks like
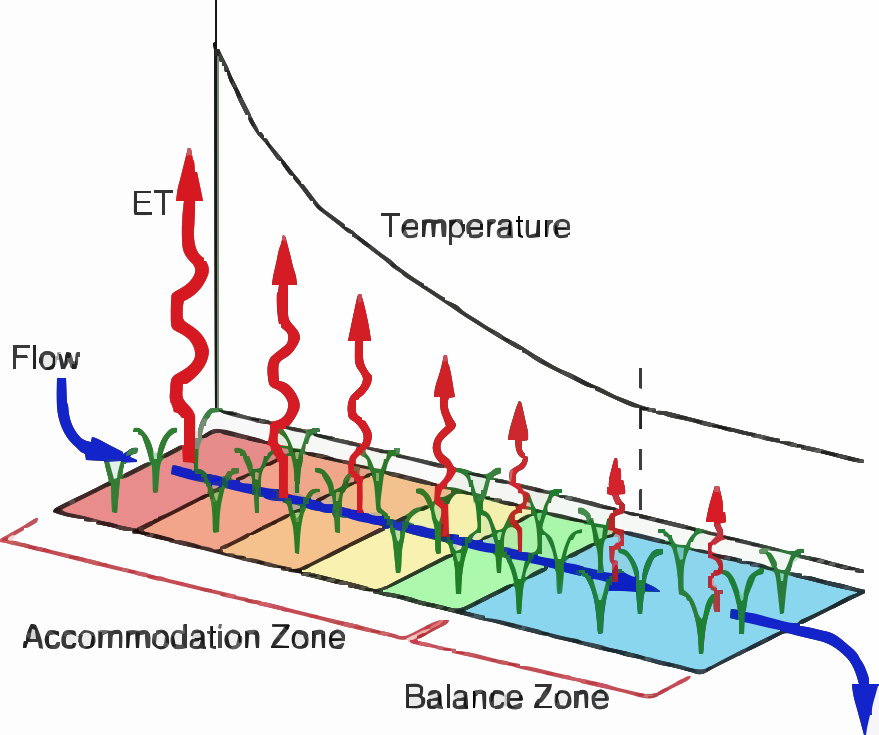
This is one of the small sponges — a treatment wetland where a parking lot's pipe meets the creek. Storm water arrives hot and dirty. It moves slowly through the reeds: the sediment settles, the plants take up the nutrients, and the water sheds its heat to the air. By the time it reaches the creek it's clean, cool, and calm — and unlike a concrete pond, it gets better every year it grows in.
Kadlec & Knight, Treatment Wetlands, as taught in Clemson Ecological Engineering (BE-4240). Used with permission.
Hope with a shovel.
Slow the water down. Spread it out. Soak it in. Store it. Share it — from a single backyard swale to the whole watershed. The same hands that paved it can bring the water back.
The receipts
Everything here is built from public federal data — screening-level, meaning it tells you where to look, not what a site survey would find. Take the numbers, check them, use them.
Sealed surface: USGS Annual NLCD Collection 1, EPSG:5070, 30 m, pulled 2026-07-22; boundaries US Census TIGERweb, held fixed. A separate 2001–2021 NLCD product reproduces 2021 within ±1.2 points. Canopy, runoff, heat and land-cover figures from the Green Infrastructure Center reports for the City of Clemson.