The Watershed Atlas  ·  No. 01 — Lower Eighteenmile Creek  ·  No. 02 — Hunnicutt Creek

Clemson  ·  Hardening — the quiet one

The Watershed Atlas · No. 01

Lower Eighteenmile Creek

A 25-square-mile watershed in the South Carolina Upstate, read from open public data — the ground it sits on, the way it is changing, and what that change means for the water leaving it. This is the first entry in an atlas built to do the same for any watershed.

24.9 sq mi drains to Lake Hartwell 184 stream reaches mapped 87% one soil group
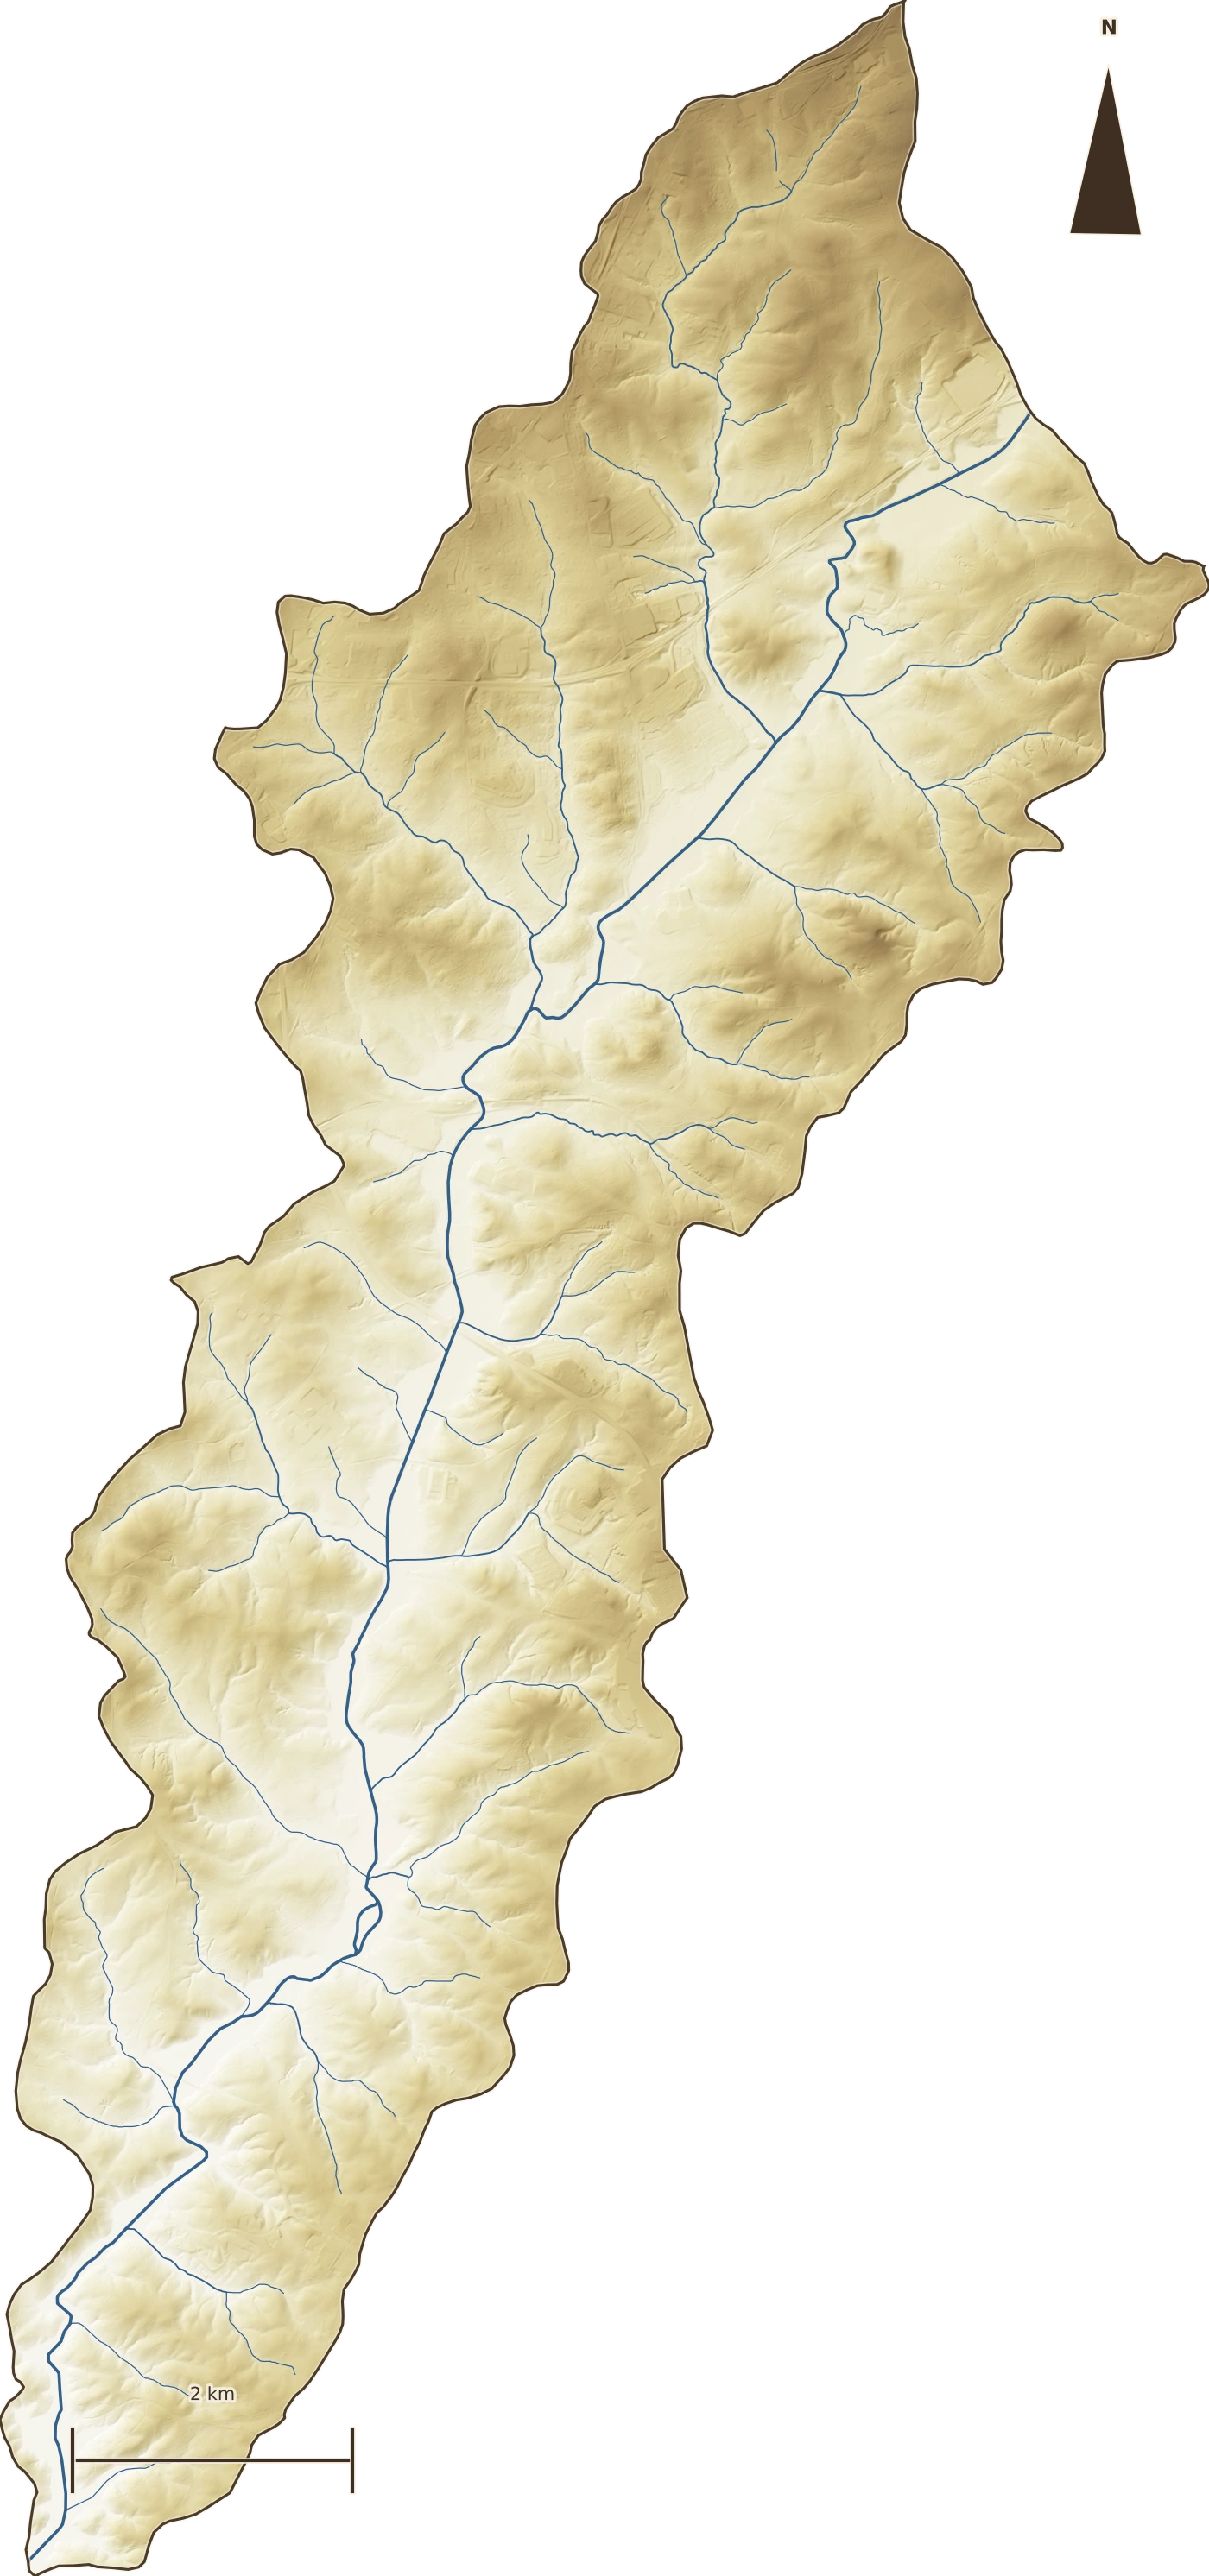
Shaded-relief terrain map of the Lower Eighteenmile Creek watershed with its stream network traced in blue, oriented north, roughly nine miles from ridge to confluence.
Terrain & streams · USGS 3DEP 1 m LiDAR hillshade + NHDPlus HR flowlines. The watershed runs ~9 mi northeast→southwest, ridgeline to confluence.

The ground

Old clay hills, still mostly green

Lower Eighteenmile sits in the Piedmont foothills: weathered red-clay ridges of the Cecil–Pacolet family, tilting south toward Lake Hartwell. Nearly nine in ten acres share a single soil behavior — hydrologic group B — so the whole watershed drinks water at about the same rate. That makes it unusually easy to read.

Most of it is still green. In 2023, forest and farmland together cover about 60% of the watershed. That is the good news, and the opportunity — there is a lot left to keep. It is also changing faster than a drive through it would suggest.

48.8%
Forest cover, 2023 — the largest single class
86.9%
Soils in hydrologic group B (Cecil · Pacolet · Madison · Hiwassee)
030601010602
HUC-12 · the watershed's national ID

What's changing

The ground is hardening

Impervious cover — roofs, roads, parking, anything the rain runs off instead of soaking into — has climbed from 4.7% of the watershed in 1985 to 8.4% in 2023. In plain acres, that is about 580 new acres that now shed water like a roof: a 77% jump in a single generation.

Impervious cover, 1985–2023

Share of the 15,945-acre watershed that is impervious. Source: USGS EROS Annual NLCD Collection 1, Fractional Impervious Surface, 30 m, area-weighted over the HUC-12.

Spread across 25 square miles, 8% still sounds modest. The point isn't the number today — it's the slope of the line, and what even a few points of hardening do to the water once it lands. Below, the same watershed seen as land cover and as impervious surface.

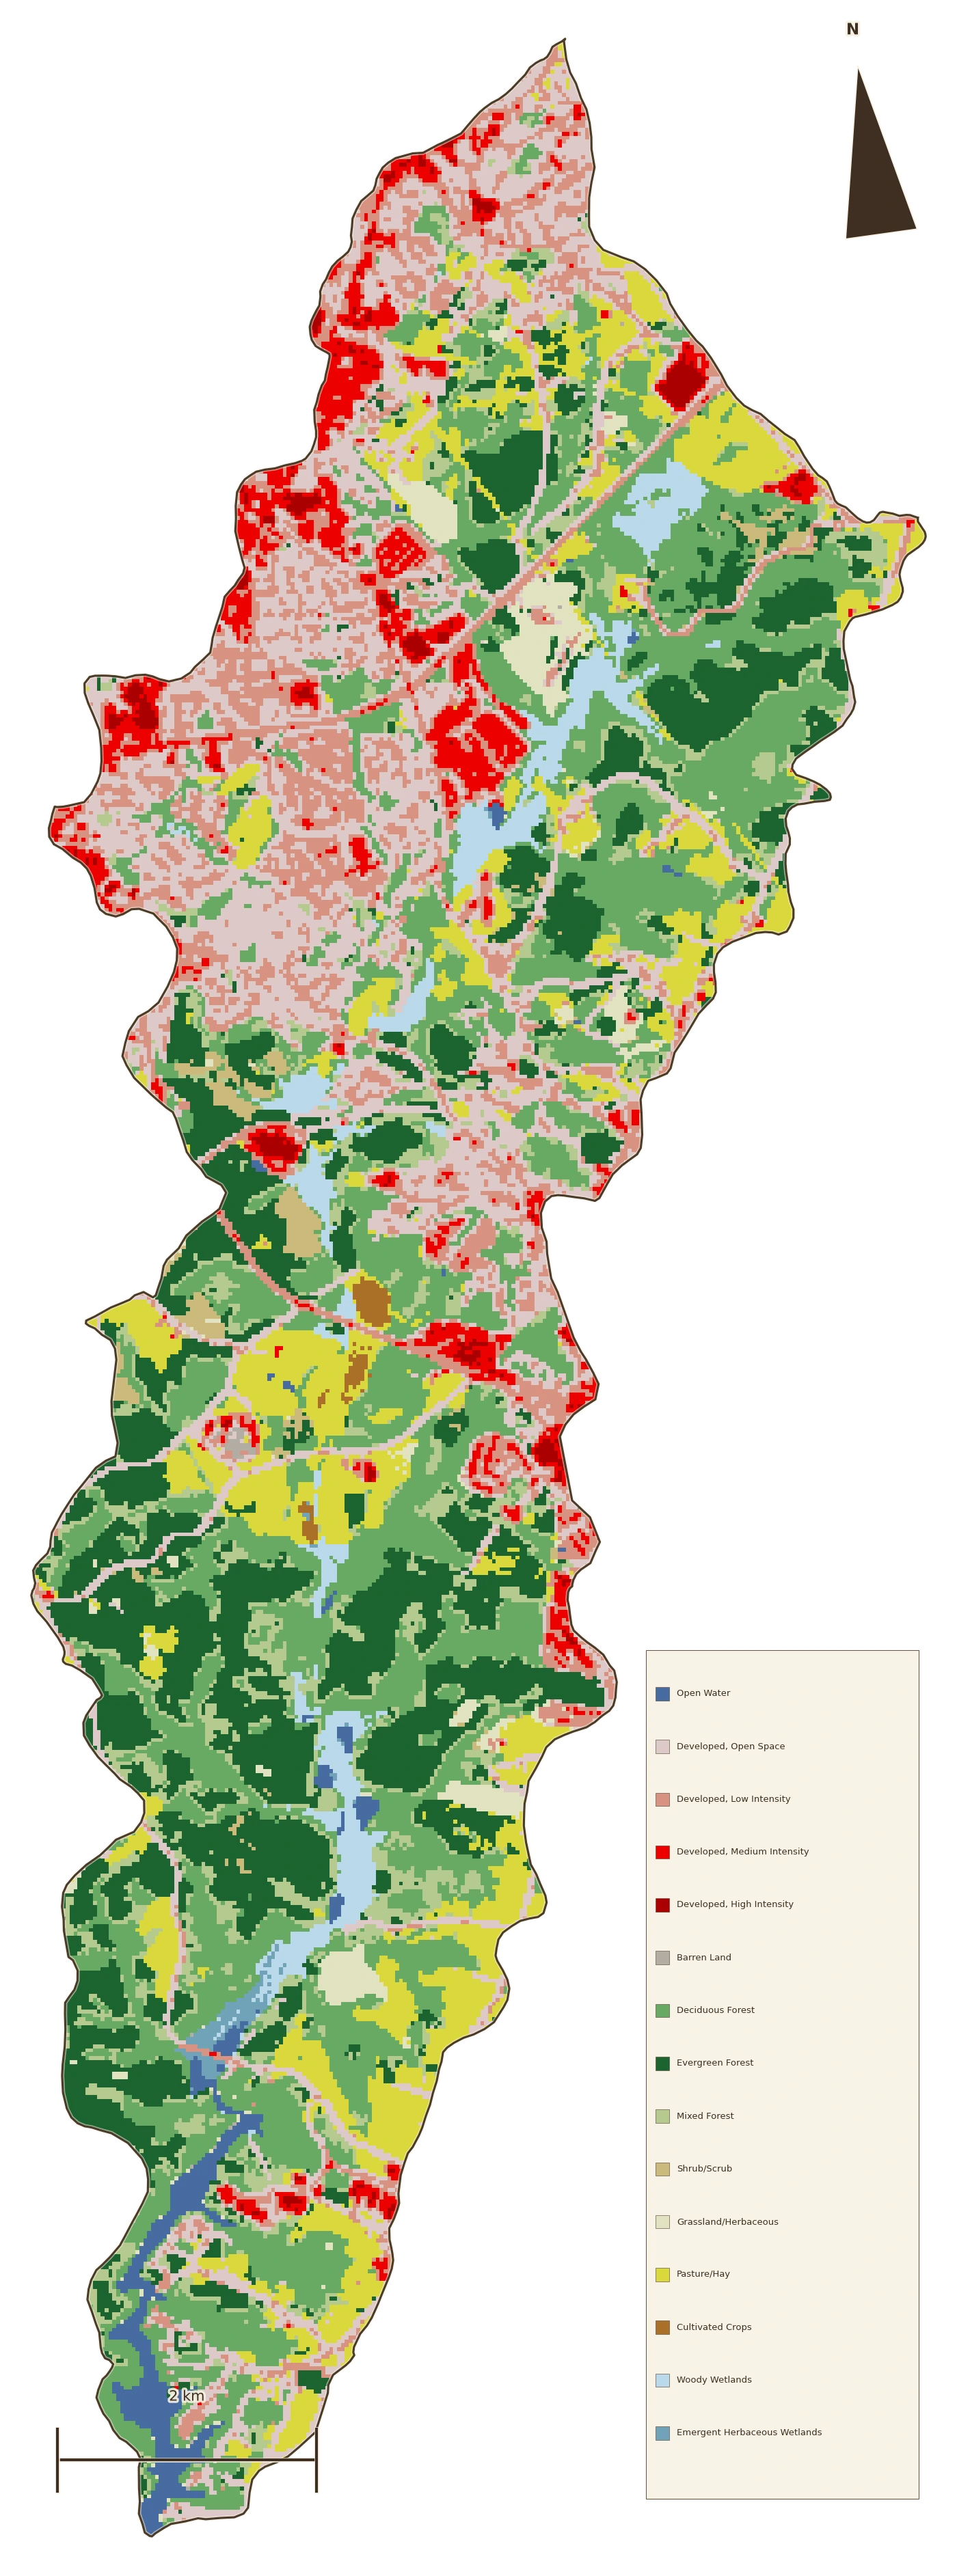
Land-cover map of the watershed, forest in green, developed ground in warm tones, farmland in gold.
Land cover, 2023 · NLCD. Green is forest, warm tones developed, gold farmland.
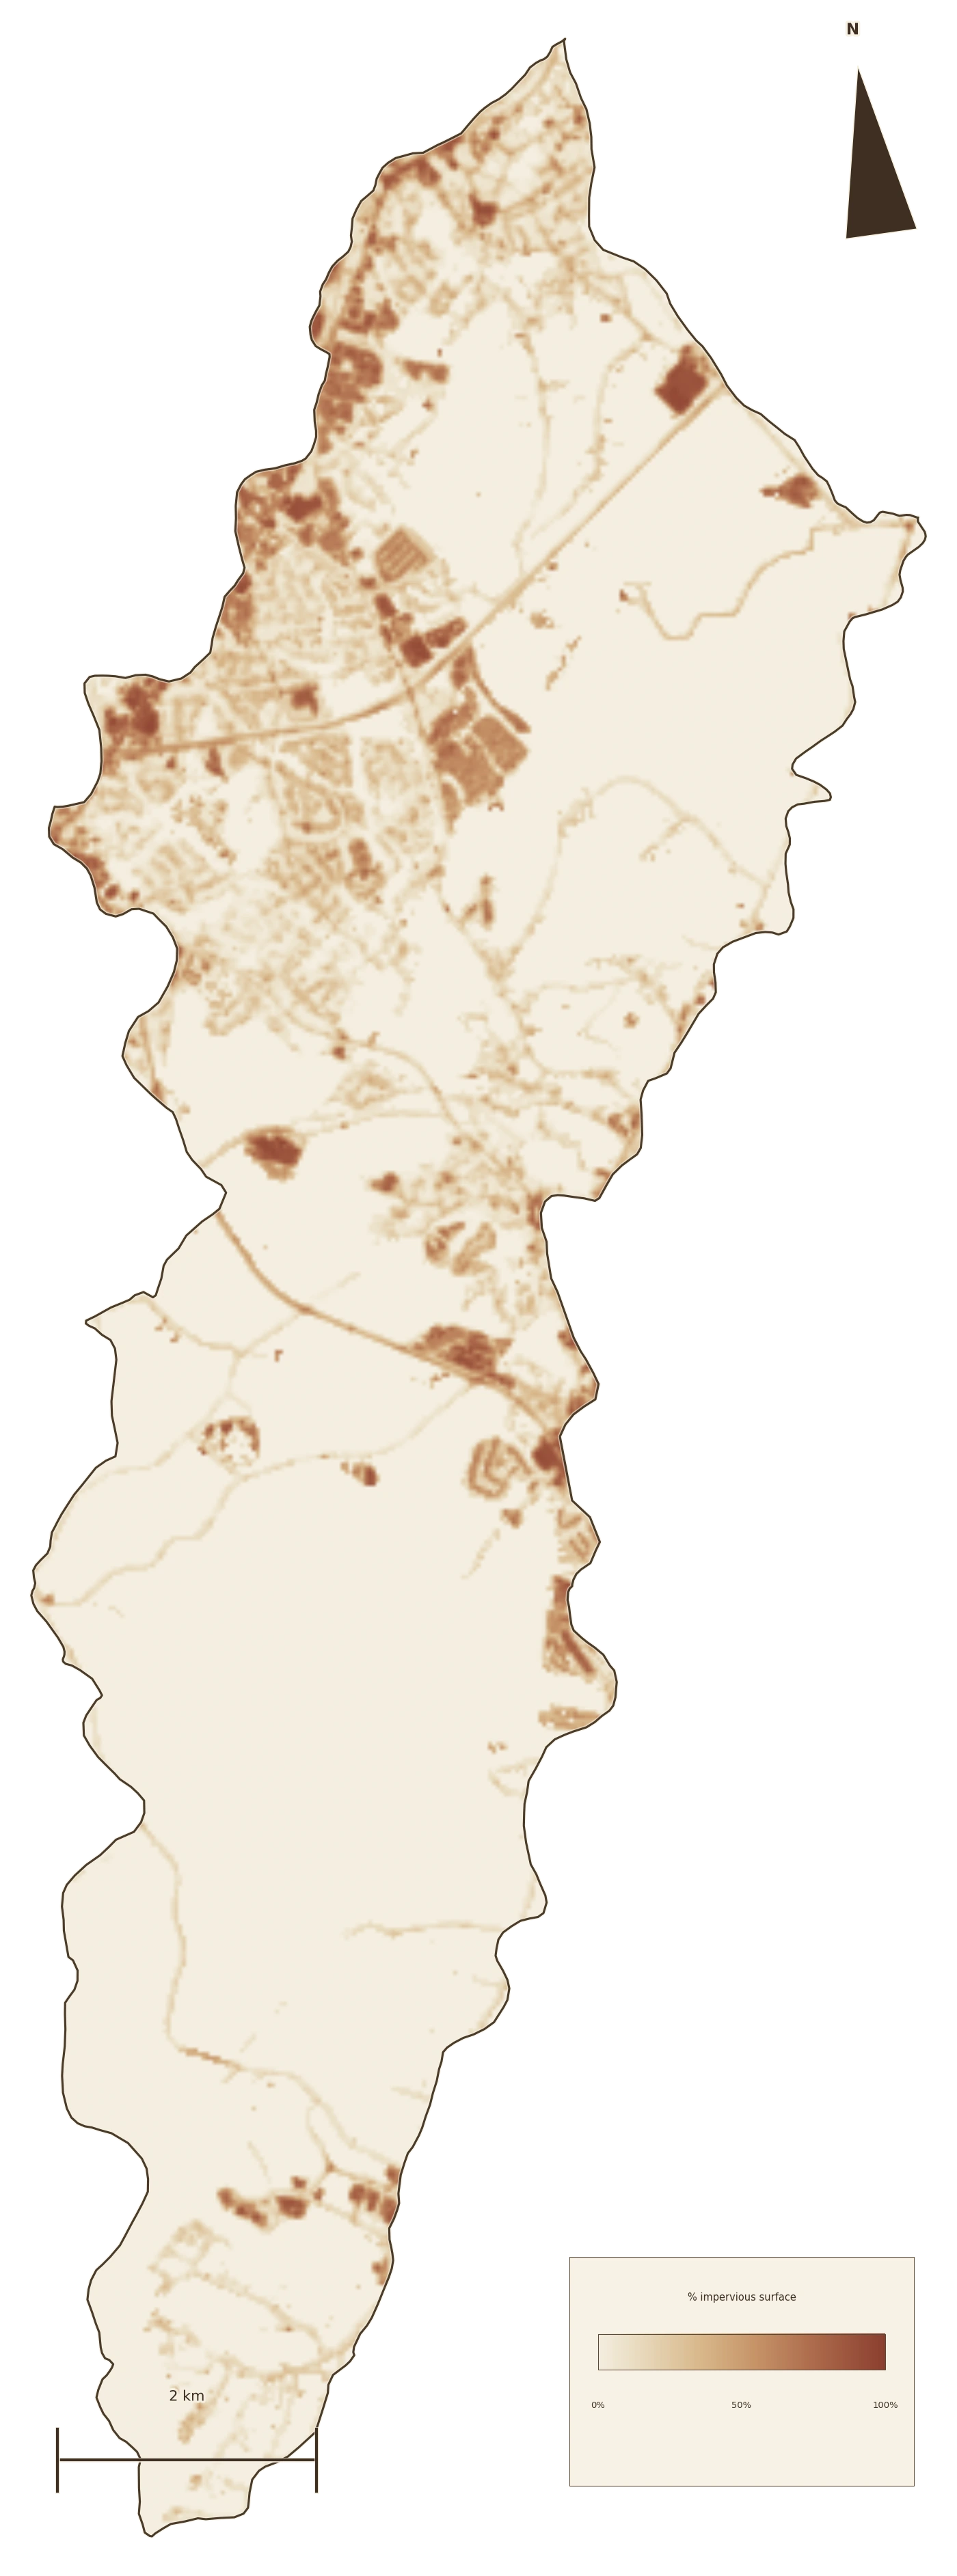
Impervious-surface map of the watershed, darker where roofs and pavement concentrate.
Impervious surface, 2023 · NLCD Fractional Impervious. Darker = more hardened; note the concentration along road and town corridors.

Where the green is

Forest traded for developed ground

Here is the whole land cover, year by year. Drag the slider to move through time; click a wedge to trace one class. Since 1985 the watershed has lost about 1,320 acres of forest and gained about 1,540 acres of developed land — very nearly an acre-for-acre trade.

Lower Eighteenmile Creek

Land cover by area · 2023

The Upstate

Composition, not size · same year
2023
Click any wedge to trace how that cover changed from 1985 to 2023.

Donuts compare composition, so a 25-square-mile watershed and a whole region sit side by side fairly. Read across places, not sizes: Lower Eighteenmile is still a green watershed hardening at its edges, where the campus is already mostly built and the Upstate and state carry big reservoirs in their "open water" share.

What the water does now

Same storms, more runoff

Hardening changes how the watershed handles rain, and we can put a number on it. Using the standard curve-number method — the same TR-55 approach an engineer uses to size a culvert — the watershed's runoff curve number rose from 64.4 to 65.7 as it hardened. A point and a third. Here is what that does to real design storms:

Runoff volume per storm — 1985 vs 2023

Total runoff leaving the 15,945-acre watershed, by storm size. Curve-number model calibrated to USGS StreamStats; storm depths from NOAA Atlas 14 Vol. 2. Acre-foot = one acre under one foot of water (~326,000 gallons).
The everyday 2-year storm now sheds about 90 acre-feet more water than it did in 1985.

That is roughly 29 million gallons of extra runoff from one ordinary rain — the storm that shapes stream channels — arriving faster, off harder ground. The 100-year storm sheds about 215 acre-feet more. The watershed didn't get more rain; it got less able to absorb it.

Why it matters downstream

That water doesn't disappear — it carries the hillside with it

Runoff that used to soak in at elevation now runs off fast, over hardened ground, picking up sediment and nutrients and carrying them downstream. Lower Eighteenmile is already the state's highest-priority impaired stretch for turbidity and nutrients. And, remarkably, no one has done the loading analysis that would say by how much, or from where.

This atlas is a first cut at that gap — built entirely from open data, so anyone can check it, extend it, or point it at the watershed next door.

Slow it · spread it · sink it

What we can do

Keep the water where it lands

The fix isn't exotic. Every acre we harden exports a little more responsibility downstream. The response is to stop exporting it — to keep the water at elevation and let it sink in, across thousands of small distributed places instead of a few big pipes.

Rain gardens, restored wetlands, regraded swales, forested buffers, farm ponds, better-graded new development — a watershed's worth of small moves that, added together, hand the creek back the behavior it had when 90% of this ground was still soaking up its own rain. None of it is speculative; all of it is buildable now.

That is a design problem, and a solvable one. The atlas exists to make it legible — to show where the water goes, where it is changing, and where the highest-leverage places to slow it down actually are. Lower Eighteenmile is watershed No. 01. The method is the same for the next one.

The receipts

Every number, from open data

All figures on this page are computed locally and reproducibly from public sources — no proprietary data, no black boxes. The runoff model was validated out-of-sample: calibrated on the full-watershed StreamStats point, it reproduced a held-out design point within 0.5% of its independent value.

Impervious & land coverUSGS EROS Annual NLCD Collection 1 — Fractional Impervious Surface and Land Cover, 30 m, 1985–2023, area-weighted over the HUC-12.
Streams & boundaryUSGS NHDPlus HR flowlines; USGS Watershed Boundary Dataset HUC-12 030601010602 (15,945 ac).
Soils / hydrologic groupUSDA SSURGO via Soil Data Access — dominant-condition HSG, area-weighted (86.9% group B).
TerrainUSGS 3DEP 1 m LiDAR — hillshade, slope, and flow layers derived locally.
Design stormsNOAA Atlas 14 Vol. 2 Ver. 3 — 24-hr precipitation-frequency depths at the watershed centroid.
Runoff modelTR-55 / SCS Curve Number, calibrated & cross-checked against USGS StreamStats.

Surface-temperature (heat) layer from Landsat is in progress and will be added as the atlas grows. Impairment status: SCDES 303(d) — Lower Eighteenmile Creek listed for turbidity and total nutrients, no TMDL on record.