The Watershed Atlas  ·  No. 01 — Lower Eighteenmile  ·  the atlas  ·  No. 05 — Reedy River

Upstate  ·  Hardening —

The Watershed Atlas · No. 05

Reedy River

Greenville’s river — from the city’s hardening hills down to Lake Conestee, the old mill pond that has quietly caught a century of what the watershed sent downstream. At 63 square miles it’s the biggest, most built-up, and most impaired watershed in this atlas, and the clearest picture of where all of this ends up.

62.7 sq mi to Lake Conesteedrains downtown Greenville11 impaired segments92% one soil group
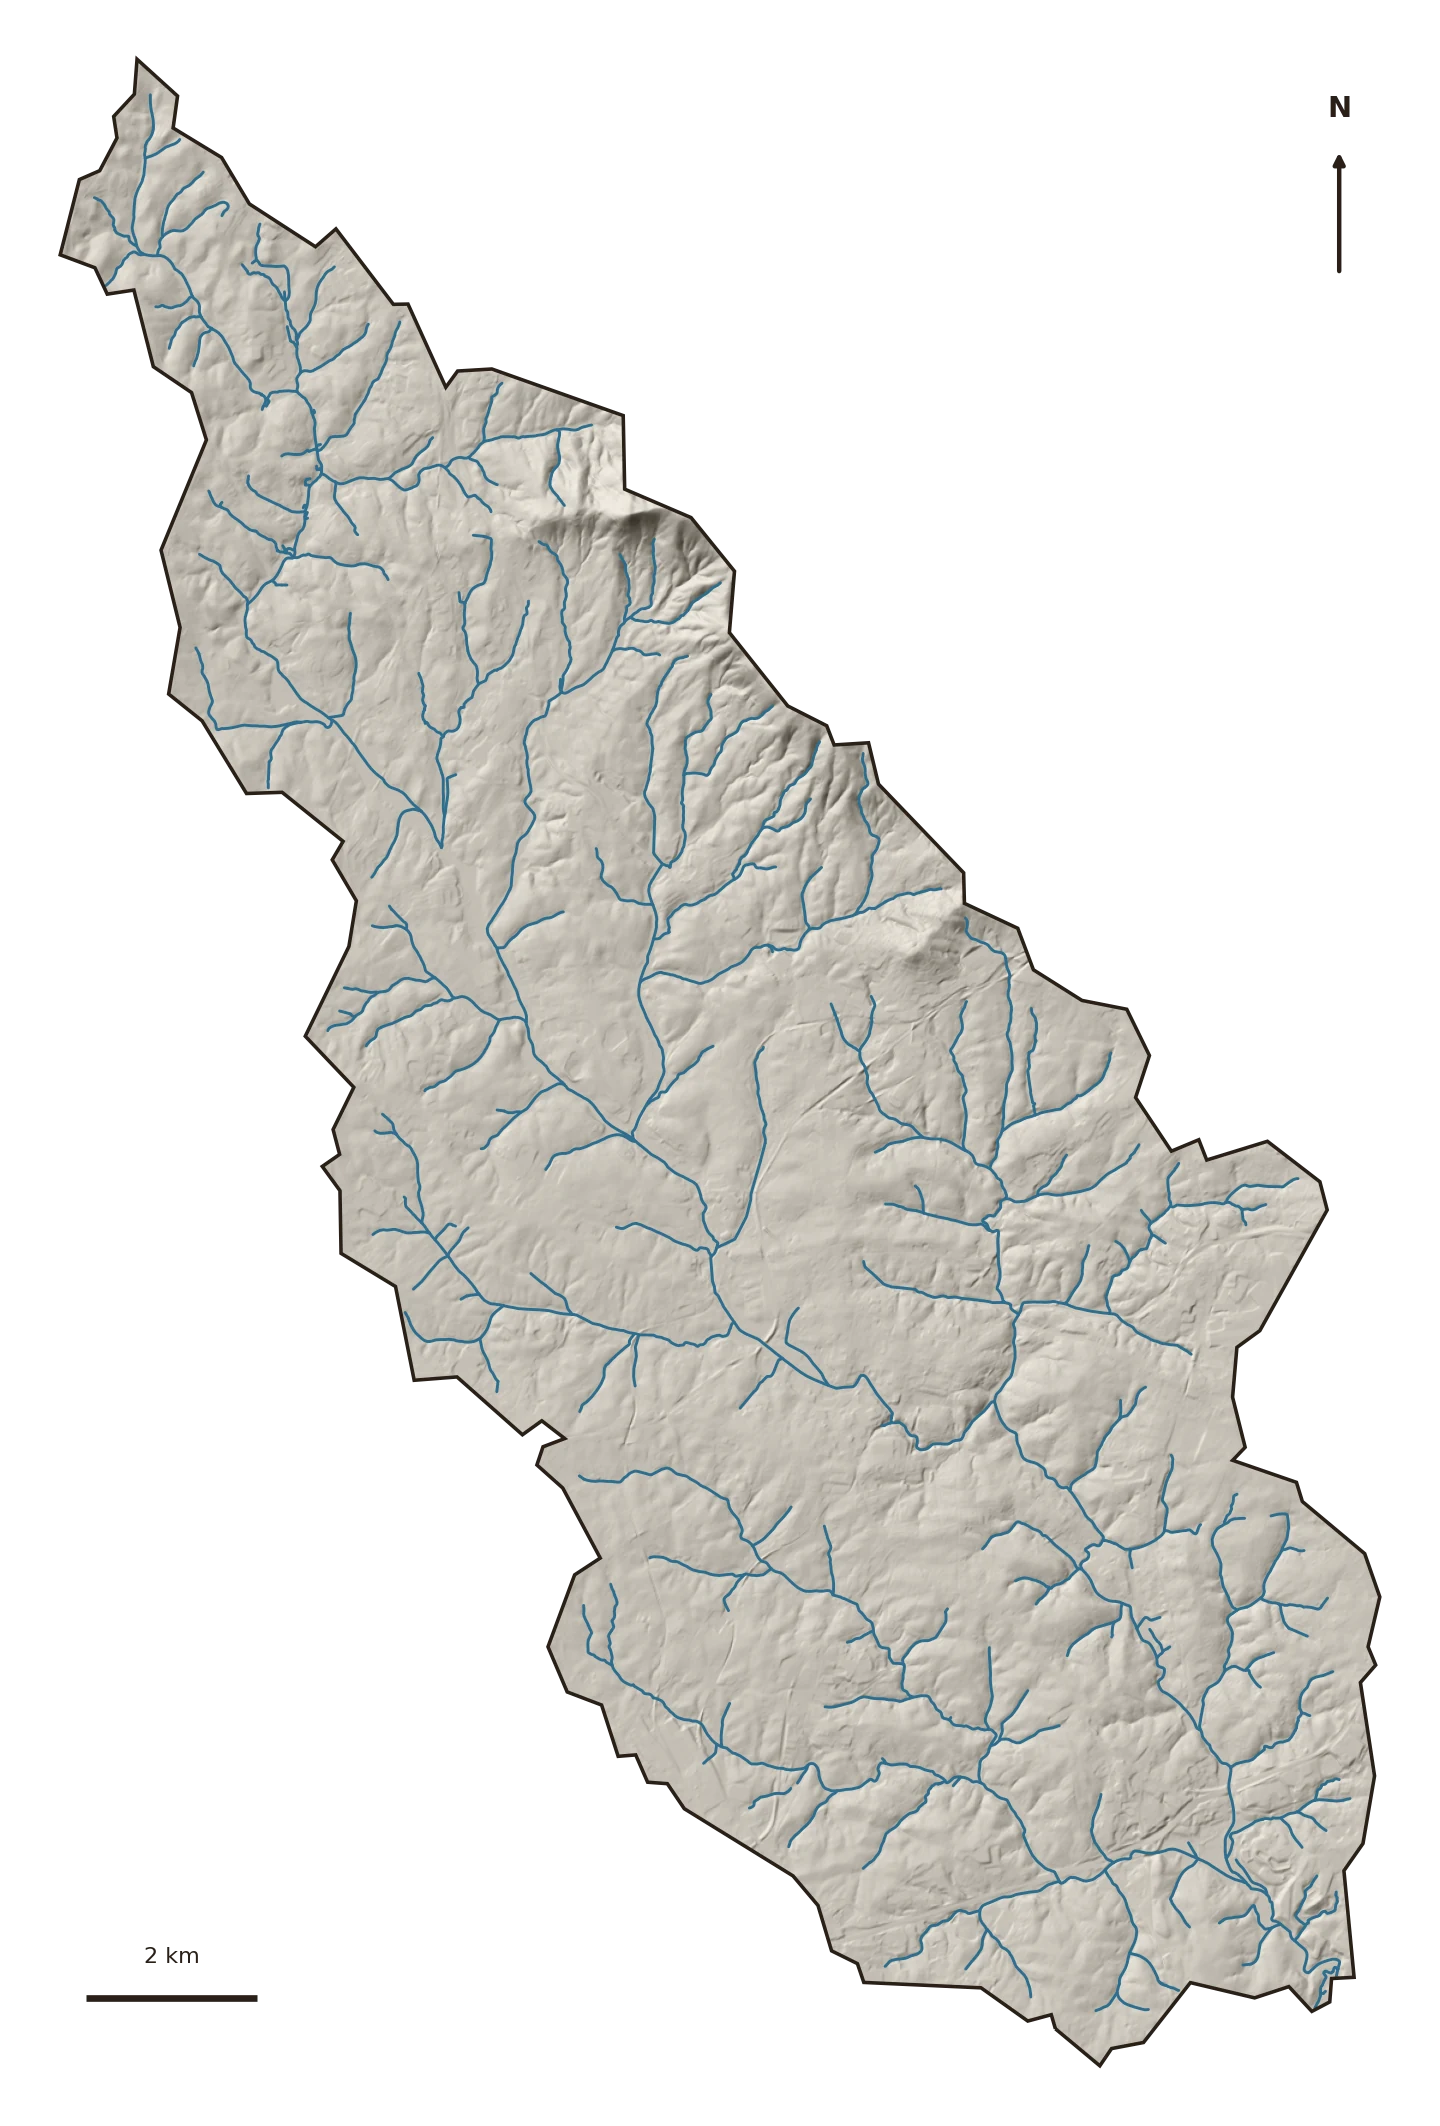
Terrain and stream map of Reedy River
Terrain & streams · USGS 3DEP LiDAR hillshade + NHD flowlines. The Reedy gathers downtown Greenville and drains south to the Lake Conestee dam.
The ground

A city’s worth of watershed

The Reedy drains 63 square miles of the Greenville metro — downtown, industry, and the neighborhoods spilling out from it — south to Lake Conestee, a 400-acre former mill impoundment now ~90% filled with sediment and listed as a Superfund site for the toxics that came to rest in it.

It’s the same Piedmont clay as the Clemson creeks (92% group B). Everything else about it is scaled up.

28.6%
Impervious surface, 2023 — past the 25% line
82.6%
Developed land, 2023 — up from 74%
11
Stream segments on the 303(d) impaired list

What's changing

Well past the line

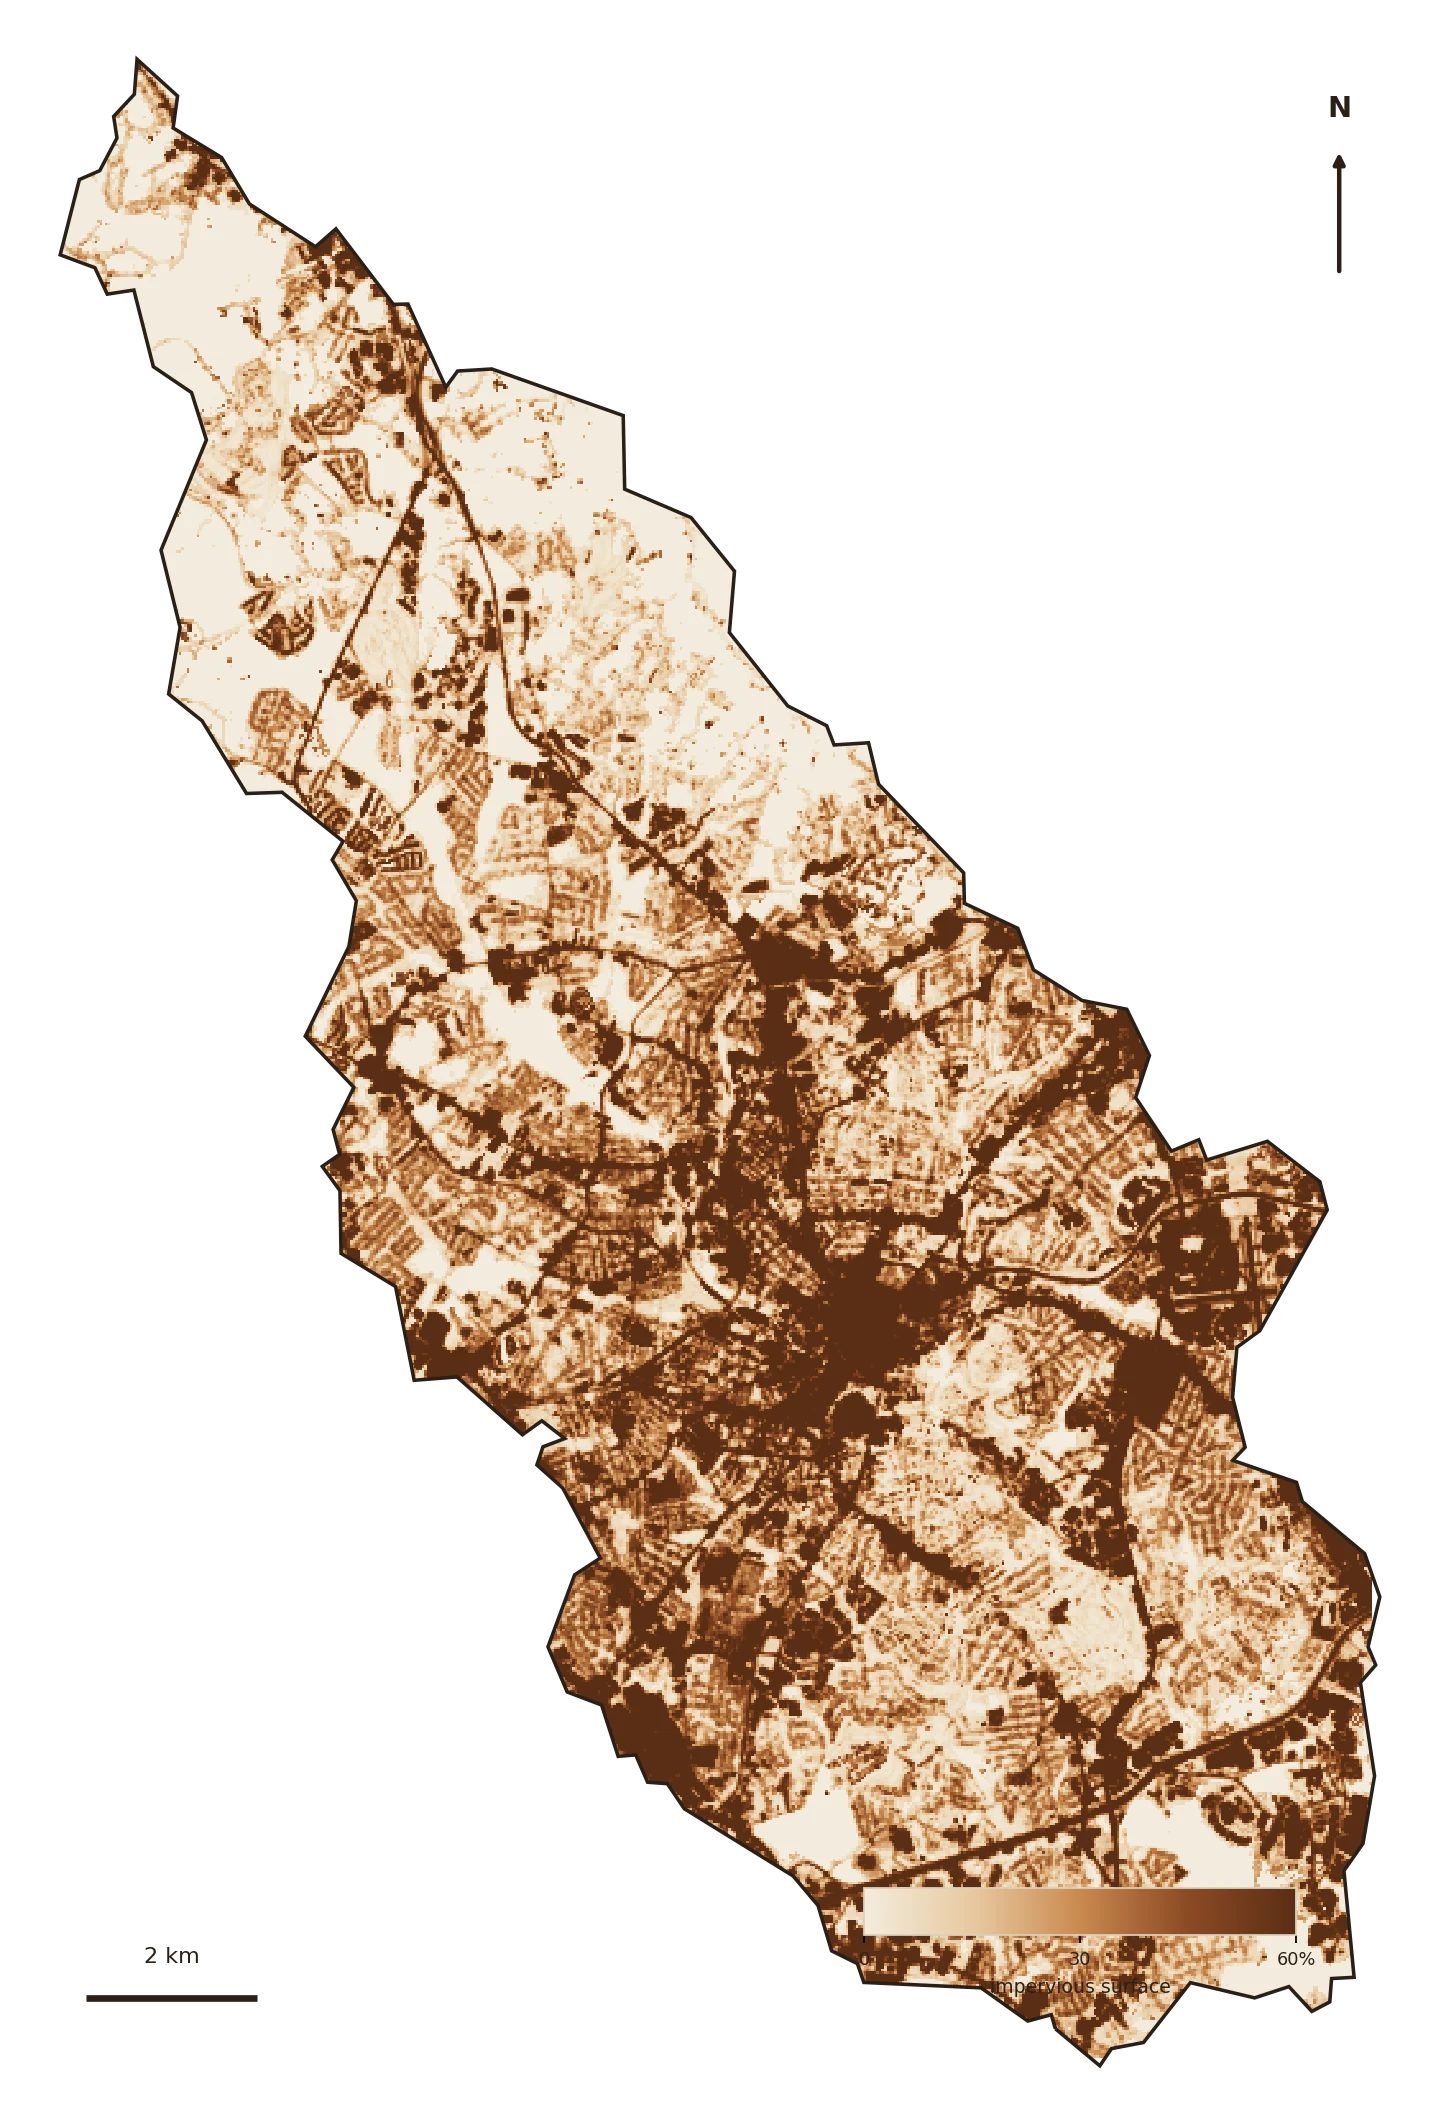
Impervious cover covers about 29% of the watershed — over the Center for Watershed Protection’s second threshold (25%), beyond which streams generally stop supporting healthy aquatic life. The Reedy crossed it and kept climbing, and it has the impaired-waters record to match.

Impervious cover, 1985–2023

Share of the 62.7-sq-mi watershed that is impervious. Dashed line = the 25% "non-supporting" threshold (Center for Watershed Protection). Source: USGS EROS Annual NLCD, 30 m.
Everything upstream comes to rest in one place.

Lake Conestee is a natural experiment: a dam that stopped the water long enough for its load to settle. What accumulated there — sediment, metals, nutrients — is the physical record of decades of upstream hardening. It’s why "where the water goes" isn’t abstract on the Reedy.

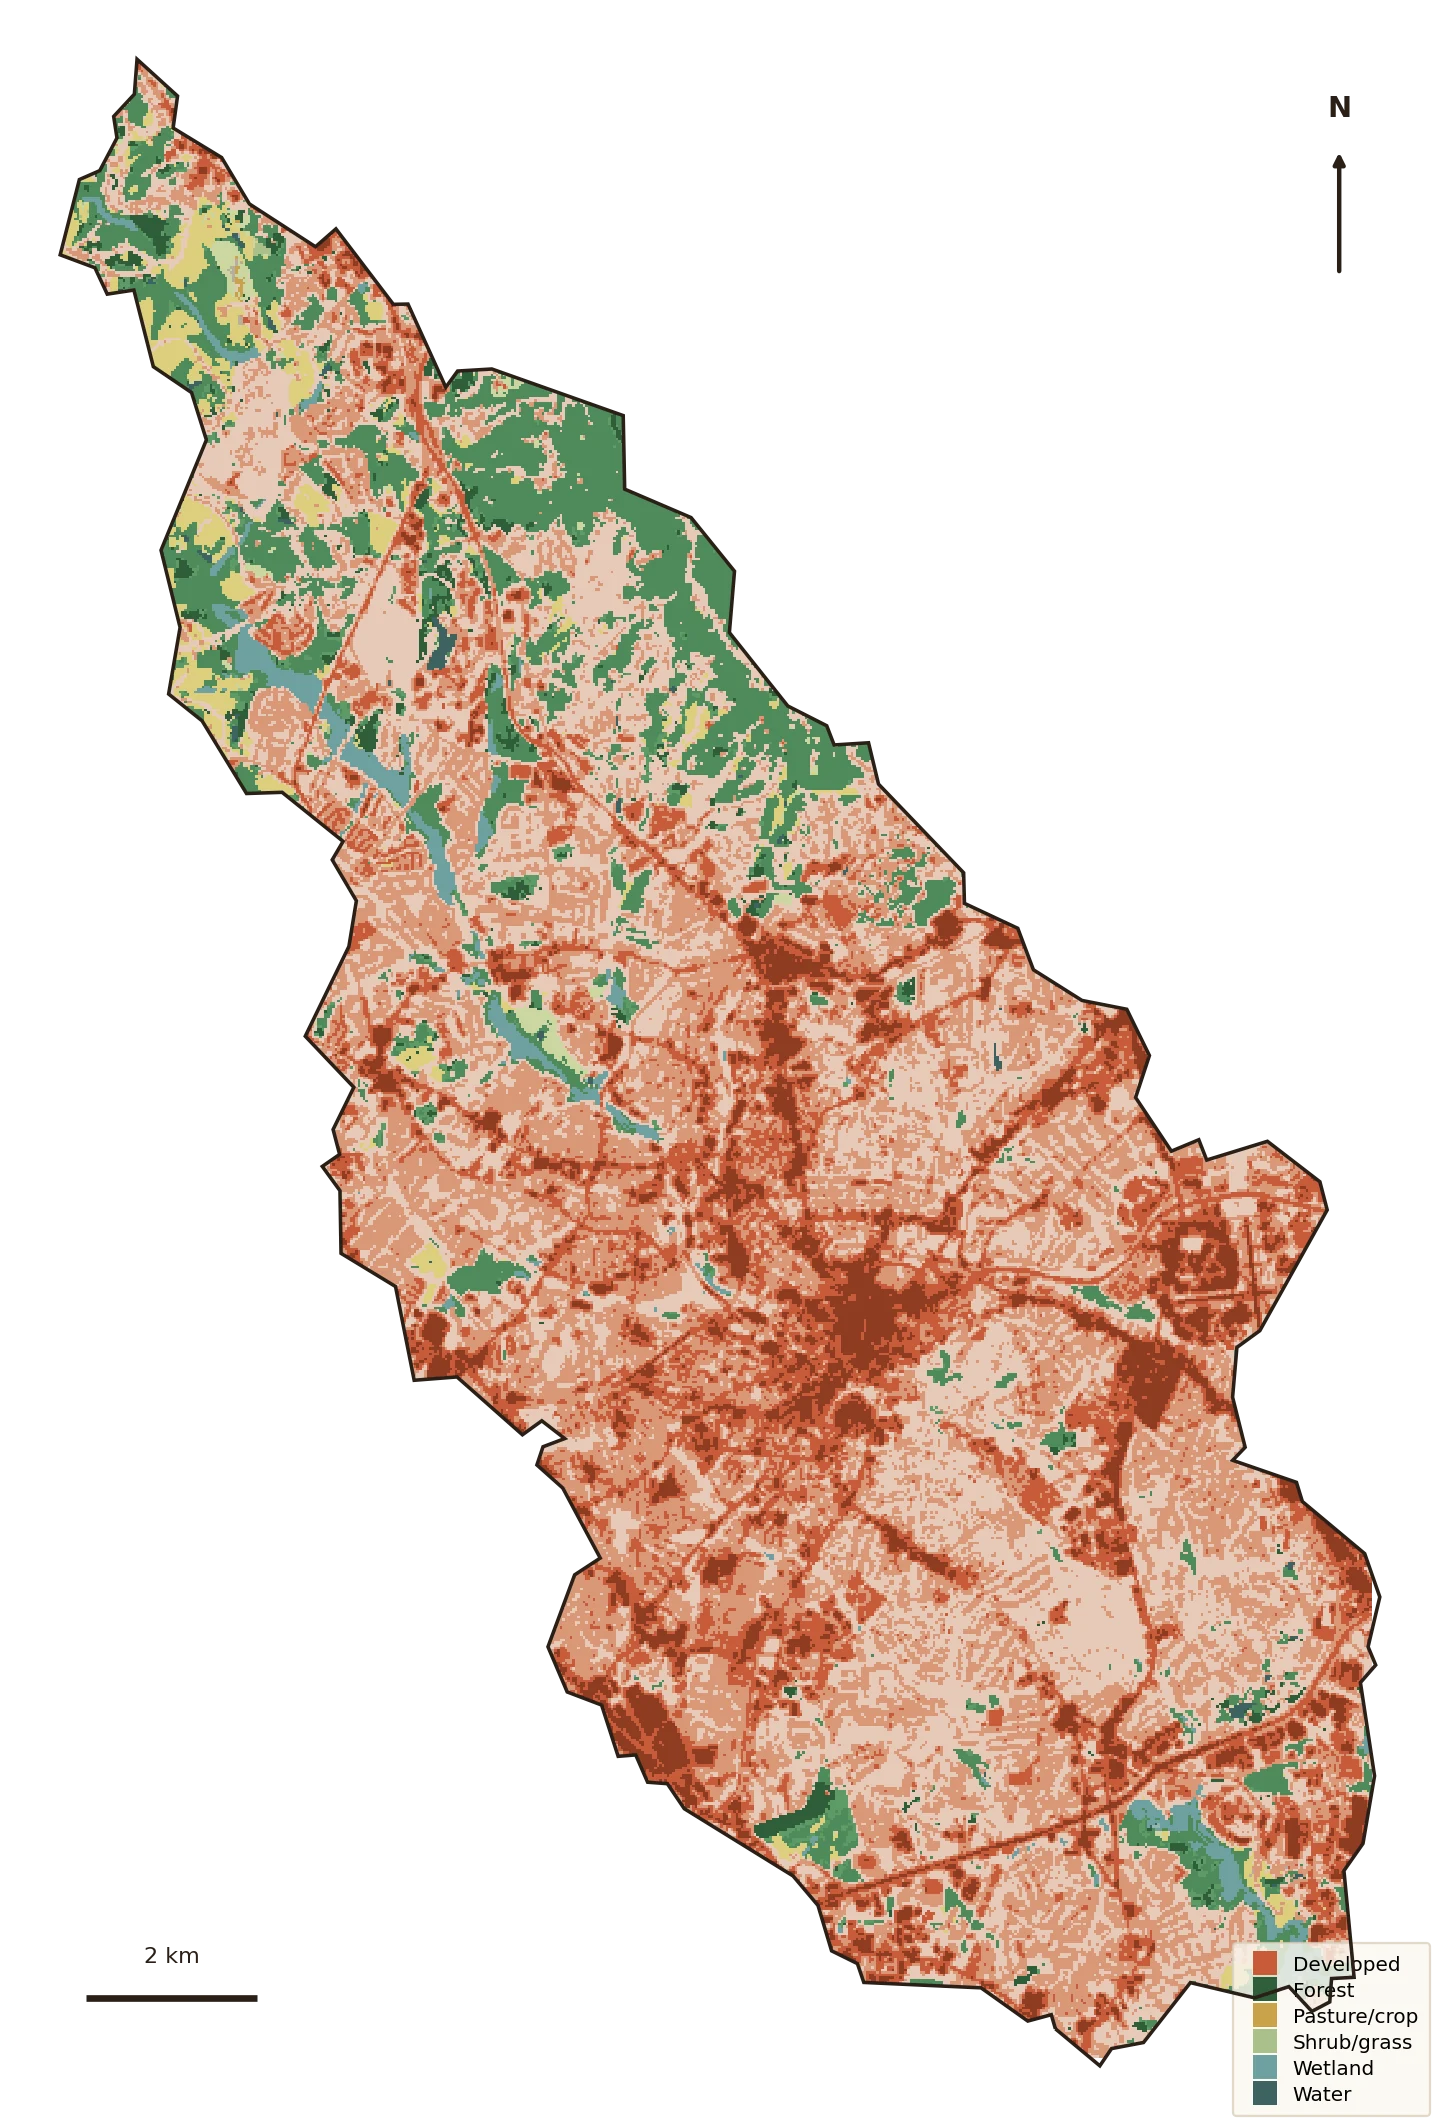
Land cover map
Land cover, 2023 · NLCD.
Impervious surface map
Impervious surface, 2023 · NLCD.

Where the green is

Almost entirely built

Developed land went from about 74% of the watershed in 1985 to 83% in 2023; forest fell from 20% to 12%. There is very little green left to do the absorbing — which is exactly why the runoff numbers below are so large.

Reedy River

Land cover by area · 2023

The Upstate

Composition, not size · same year
2023

Water quality — the 303(d) list

The impaired list — 11 segments

Reedy River carries 11 impaired stream segments on South Carolina's current 303(d) list — listed for Impaired biota (cause unknown), Metals, Pathogens (bacteria), pH (acidity).

These are the state's own findings of water not meeting its standards. Segments marked IR 5 need a cleanup plan (TMDL); several already have one.

S-013
IR 5TMDLAquatic life / ecological useRecreation use
Cause: Metals, Pathogens (bacteria)
S-265
IR 5Aquatic life / ecological use
Cause: Impaired biota (cause unknown)
S-319
IR 5TMDLAquatic life / ecological useRecreation use
Cause: Pathogens (bacteria), pH (acidity)
S-867
IR 5Aquatic life / ecological use
Cause: Impaired biota (cause unknown)
S-868
IR 5Aquatic life / ecological use
Cause: Impaired biota (cause unknown)
S-928
IR 5Aquatic life / ecological use
Cause: Impaired biota (cause unknown)
S-981
IR 5Aquatic life / ecological use
Cause: Impaired biota (cause unknown)
RS-14189
IR 4ATMDLRecreation use
Cause: Pathogens (bacteria)

Source: EPA ATTAINS (the national clearinghouse for state Clean Water Act §303(d)/305(b) assessments), current reporting cycle. “Cause” = the pollutant; “use” = what it keeps the water from supporting (swimming, aquatic life).

What the water does now

A river’s worth of extra runoff

Because the Reedy is big and hard, small changes move enormous volumes. Its runoff curve number rose from about 72.5 to 74 — and on 63 square miles that translates to a staggering amount of extra water:

Runoff volume per storm — 1985 vs 2023

Total runoff leaving the 62.7-sq-mi watershed by storm size. Curve-number model with pervious CN from the SSURGO soil mix; storm depths from NOAA Atlas 14. Acre-foot ≈ 326,000 gallons.
The everyday 2-year storm now sheds about 331 acre-feet more than it did in 1985.

That’s roughly 108 million gallons of extra runoff from one ordinary rain — arriving faster, off harder ground, and carrying the sediment and bacteria that keep the Reedy on the impaired list. The 100-year storm sheds over 600 acre-feet more.

Why it matters downstream

The whole story, at full scale

The Reedy is what the smaller watersheds in this atlas are becoming — hardening, flashing, shedding their load into a receiving water that can’t keep up. Conestee is what "downstream" actually looks like when no one slows the water up top.

The response is the same at 63 square miles as at 2: keep the water where it lands. It’s just that on the Reedy, the bill for not doing so is already visible, sitting behind a dam.

Slow it · spread it · sink it

The receipts

Every number, from open data

Delineated to the Lake Conestee dam via USGS NLDI (the pour point at the standard Greenville gage mis-routed through the Conestee wetlands, so the network-linked basin was used). Every figure computed locally from public sources.

Watershed boundaryUSGS NLDI network-linked basin to the Lake Conestee dam outlet — 62.7 sq mi.
Impervious & land coverUSGS EROS Annual NLCD Collection 1 — Fractional Impervious Surface and Land Cover, 30 m, 1985–2023.
Streams & terrainUSGS NHD flowlines; USGS 3DEP 1 m LiDAR hillshade.
Soils / hydrologic groupUSDA SSURGO via Soil Data Access — area-weighted.
Runoff modelTR-55 / SCS Curve Number; pervious CN estimated from the SSURGO HSG mix.
ImpairmentsEPA ATTAINS §303(d)/305(b) assessment service, current cycle.